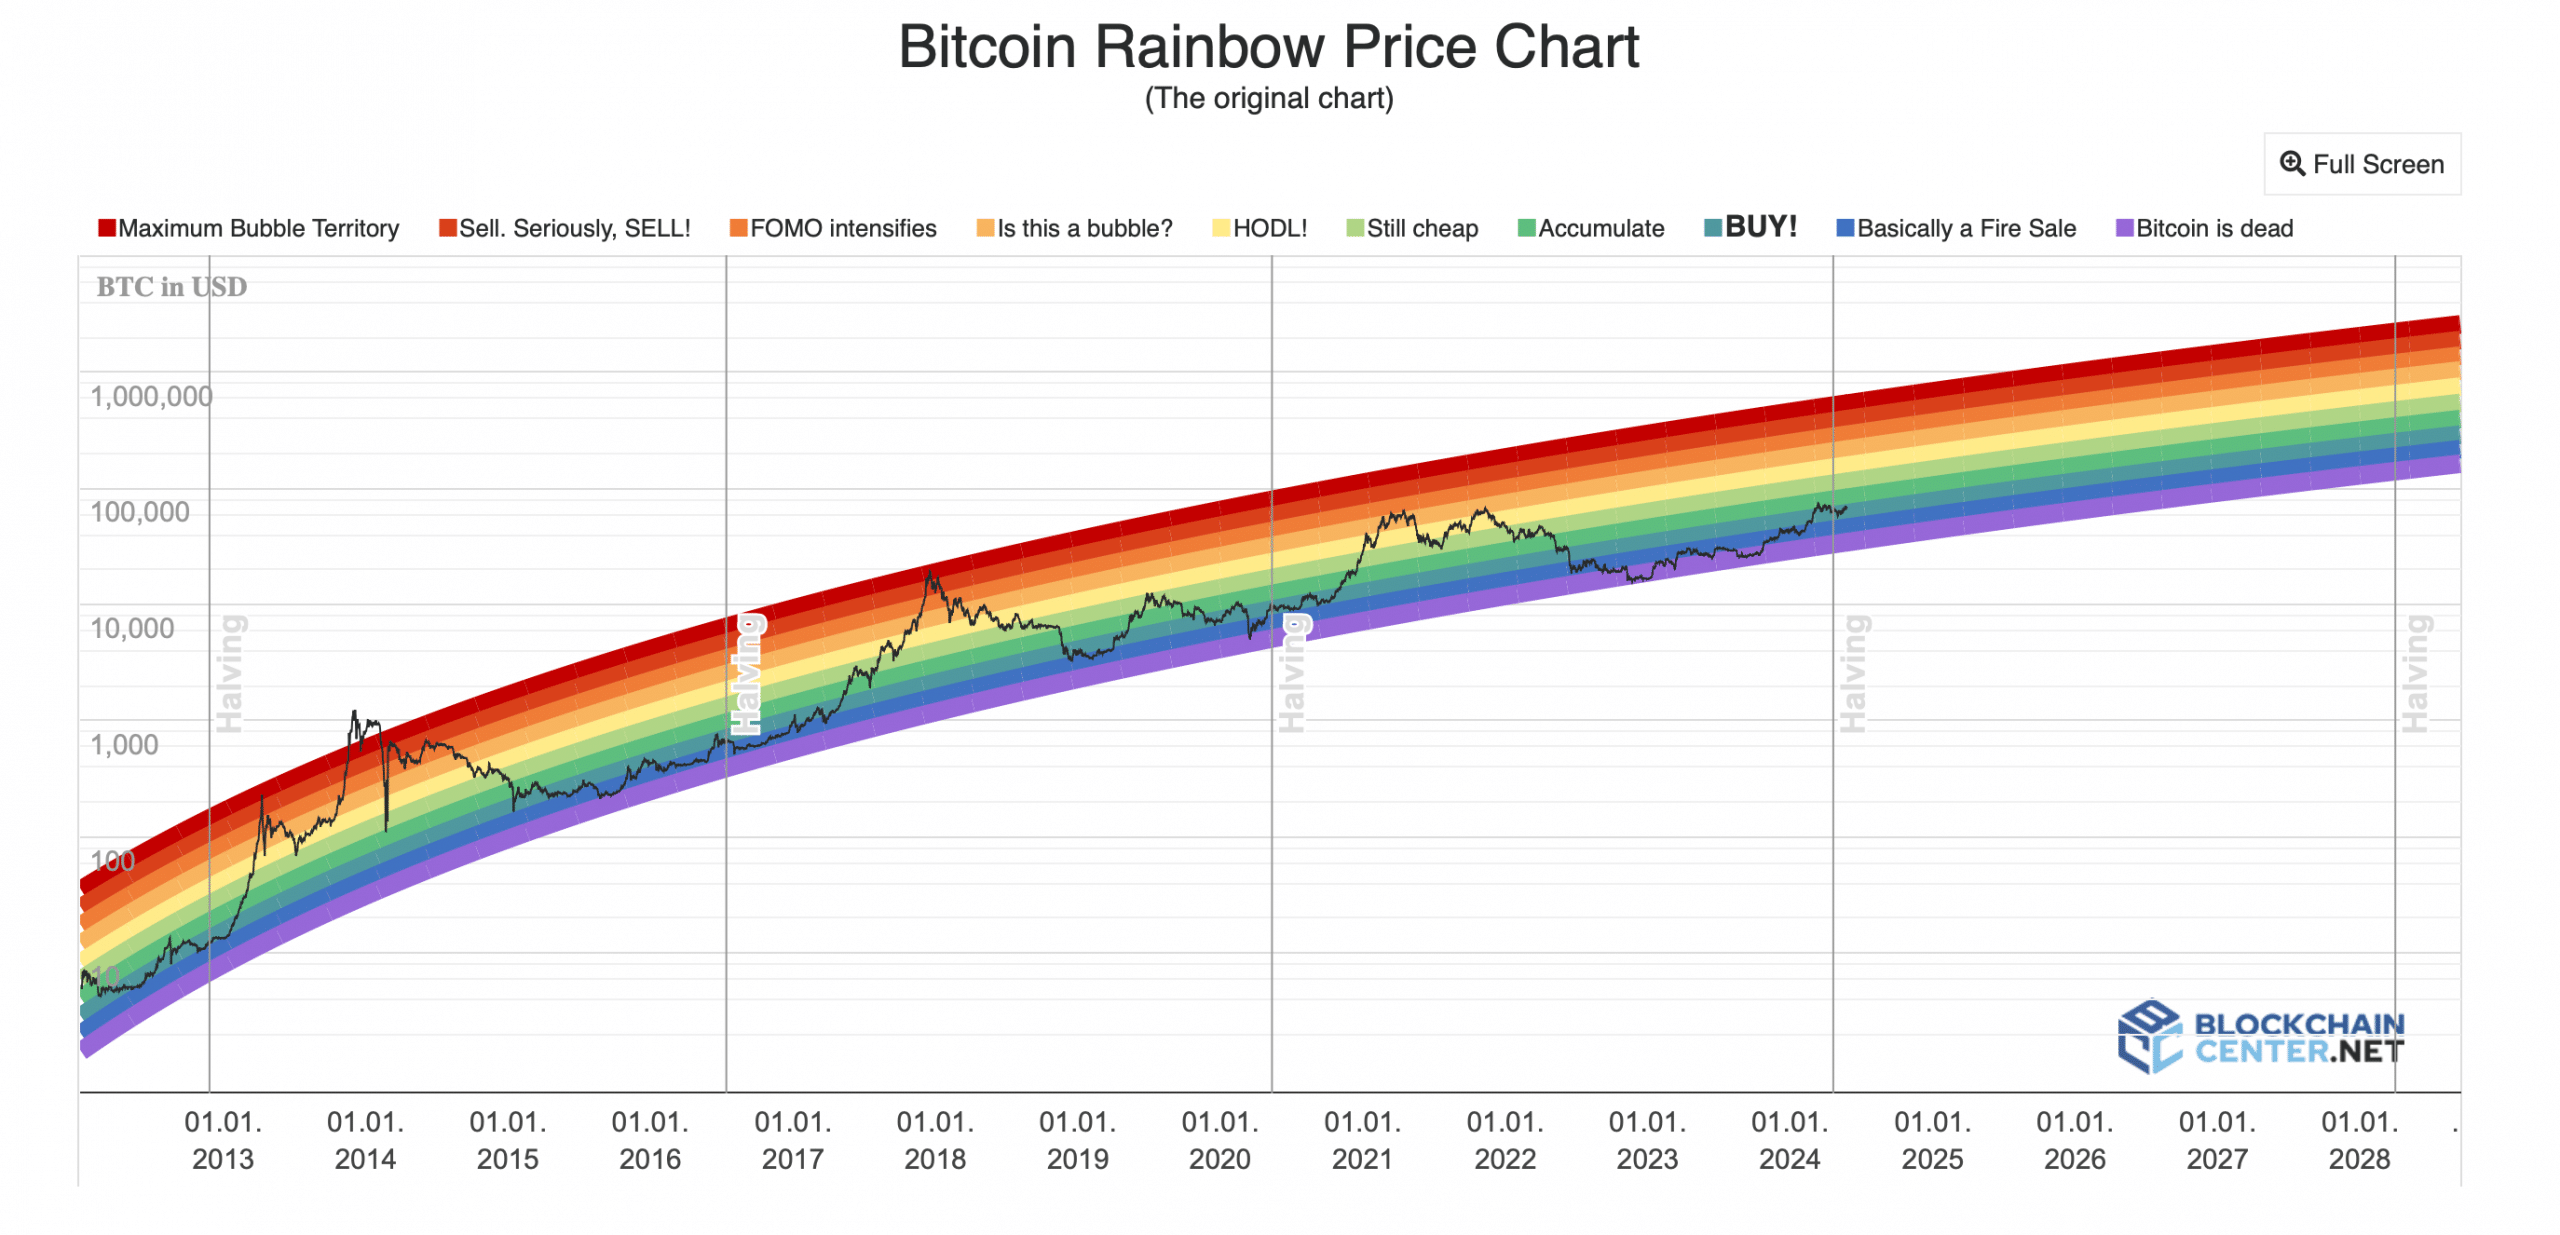
Investor confidence in Bitcoin [BTC] has waned somewhat, as the cryptocurrency king struggles to surpass the $69,000 mark. Nevertheless, the Bitcoin Rainbow Chart indicates that BTC is actually mirroring the post-halving trend of 2020.
Is it the right time to buy Bitcoin?
Bitcoin’s price volatility has decreased over the past few days, causing concerns as BTC continues to battle the $69,000 resistance.
However, investors shouldn’t be discouraged, as BTC is exhibiting patterns similar to those following the 2020 halving. Analysis shows that several months after the third halving, the Bitcoin Rainbow Chart signaled a “BUY” zone. After spending a few months in this zone, BTC’s price soared.
A similar trend is visible in BTC’s 2024 Rainbow Chart, which also indicates a buying opportunity. If this is taken into account, it might be the last chance for investors to purchase BTC at a lower price before it climbs and enters the accumulation and HODL zone.
Source: BLOCKCHAINCENTER
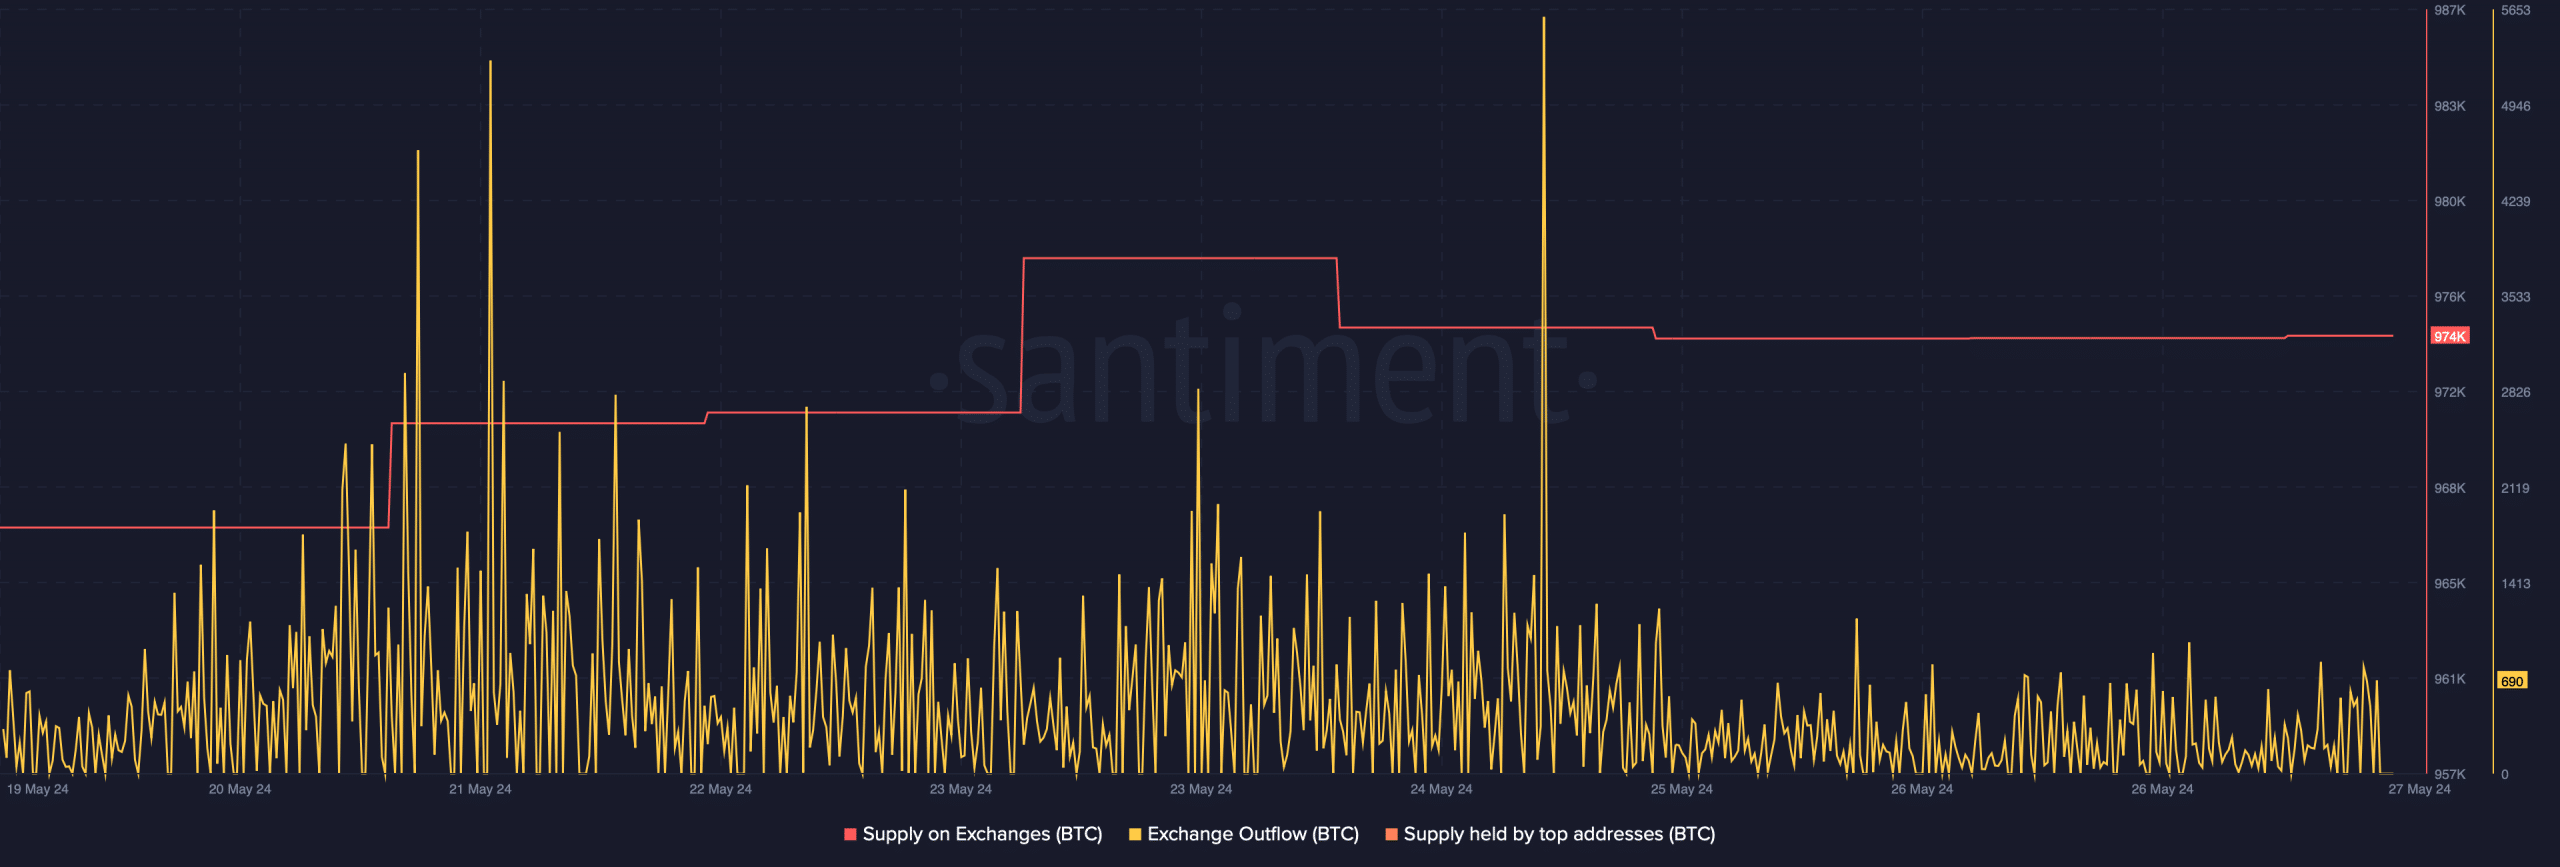
Subsequently, we analyzed BTC’s on-chain metrics to determine if investors should consider buying BTC as suggested by the Rainbow Chart. We observed that BTC’s outflows from exchanges decreased last week after a spike on May 24th. Its supply on exchanges increased, indicating that investors opted to sell.
Our review of CryptoQuant data reveals that BTC’s net deposits on exchanges have been high compared to the seven-day average, further suggesting strong selling pressure. Moreover, Coinbase Premium is in the red, indicating a prevailing bearish sentiment among U.S. investors.
Source: Santiment
Bitcoin’s Troubles Are Far from Over
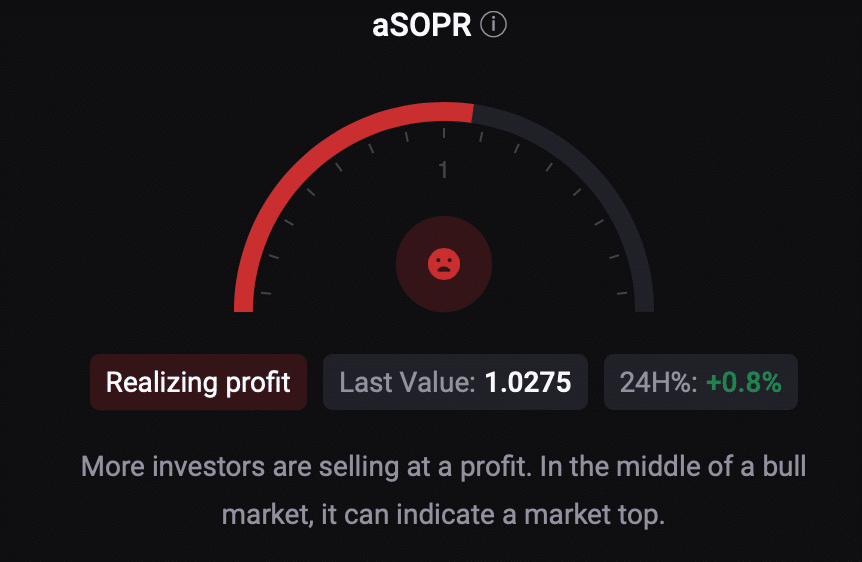
We then examined whether the increased selling pressure could lead to a price correction. It appears that investors are not heeding the Bitcoin Rainbow Chart, as its aSORP (Adjusted Spent Output Profit Ratio) is red, suggesting that many investors are selling for profit. In a bull market, this could signal a market peak.
Related: Bitcoin Halving Chart History Analysis
At the time of writing, BTC’s Fear and Greed Index stands at 74, indicating a “greedy” market phase. When this metric reaches such levels, it often points to an impending price correction.
Source: CryptoQuant
Like the metrics, most technical indicators also appear bearish. For instance, the MACD indicates a potential bearish crossover. The Relative Strength Index (RSI) has noted a decline, suggesting an imminent price drop. However, the Chaikin Money Flow (CMF) remains positive as it trends upward.


