Bitcoin (BTC) is currently trading at $66,000, marking an impressive 8% increase over the past week. Concerns about a potential sell-off during the halving period are diminishing.
Bitcoin ETFs have also seen significant inflows this week, indicating a clear rise in demand. This surge to new highs has alleviated selling pressure in recent weeks, but can the bulls sustain this momentum?
Assessing the Bulls’ Ammo
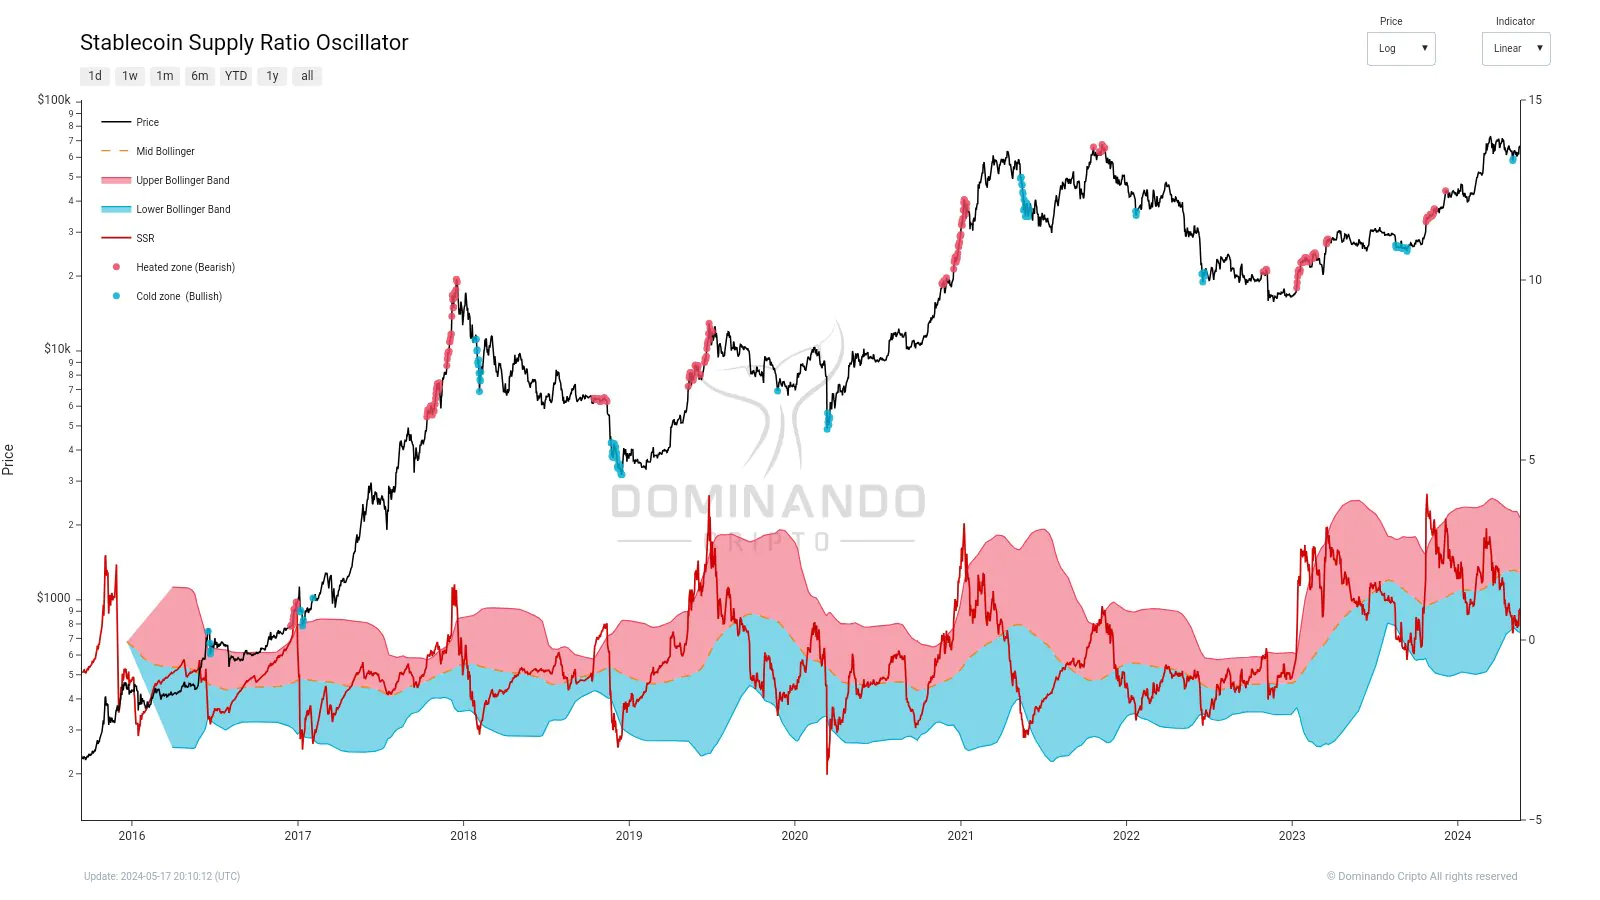
A crypto analyst highlighted in a post on X (formerly Twitter) that the Stablecoin Supply Ratio (SSR) oscillator indicates a bullish trend. This technical indicator evaluates the market sentiment of stablecoins versus Bitcoin over time.
It is calculated by taking the current SSR and its difference from the 200-period simple moving average. This value is then divided by its standard deviation over the same period to derive a set of Bollinger Bands (BB).
The current supply of stablecoins is plotted within these bands to provide traders with insights into market sentiment. When the SSR drops below the lower Bollinger Band, it signals low stablecoin dominance and potential bullish sentiment.
The chart highlights how the market tends to pull back when the oscillator overheats. Conversely, breaking below the lower bands often presents strong long-term buying opportunities. As with any technical indicator, the SSR oscillator isn’t foolproof, and each signal doesn’t guarantee the expected price movement.
Related: Market Volatility Ahead of $2.1 Billion BTC and ETH Options Expiry
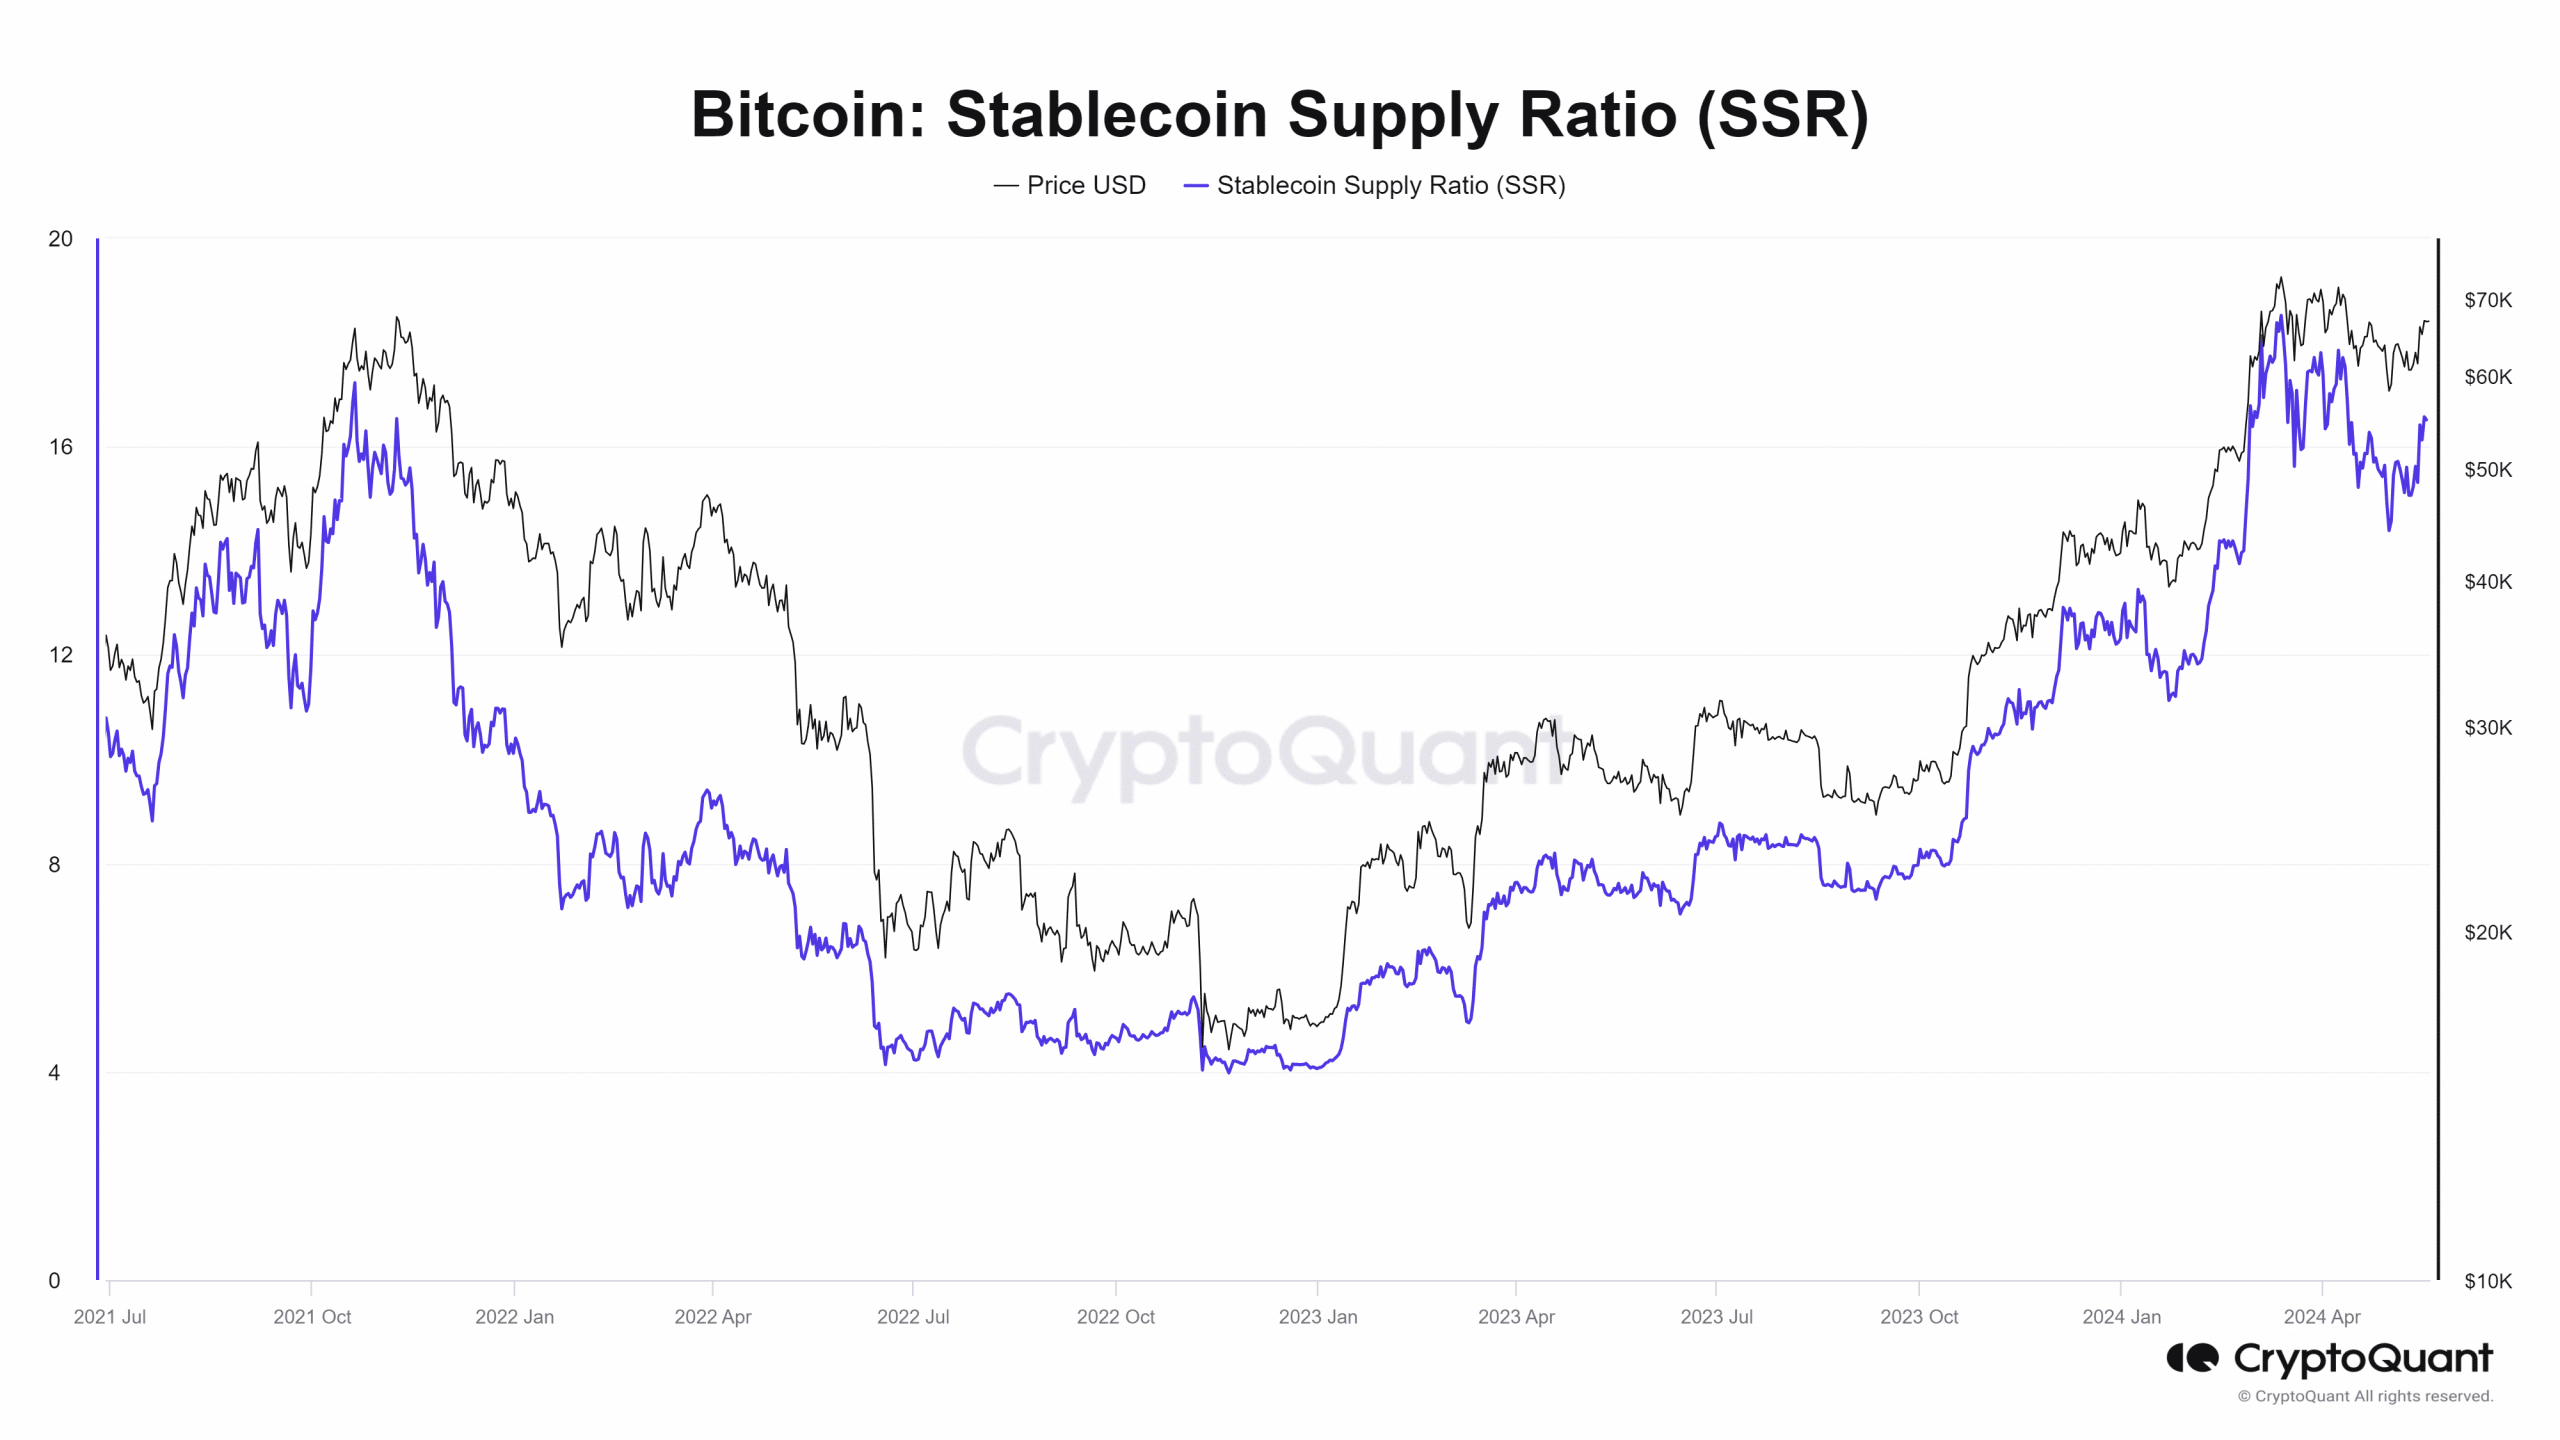
We are still in a “buy” signal
Source: CryptoQuant
The stablecoin supply ratio is below the 200-period SMA but above the lower BB. It dipped below this band in early May when Bitcoin was at $56,000, but the price quickly rebounded.
The oscillator remains near the lower BB, suggesting further upside potential. The SSR has also been trending downward over the past month. This indicator has been on a significant uptrend since October 2023, with periods of stagnation or pullbacks like those in early January and mid-May.
A month after the January pullback, Bitcoin’s price surged past the $46,000 resistance. In the next 2-4 weeks, we might see Bitcoin rally beyond the $73,000 resistance.
 OMN
OMN  BTC
BTC  ETH
ETH  USDT
USDT  XRP
XRP  BNB
BNB  SOL
SOL  USDC
USDC  TRX
TRX  DOGE
DOGE 





Nice one