Bitcoin fell to $81,000 yesterday before recovering slightly to its current price. Chart analysis and liquidation data suggest that Bitcoin is likely to enter a short-term accumulation phase.
The Fear & Greed Index currently stands at 34, reflecting market anxiety. Over the past week, this index has fluctuated between 30 and 40, even dropping into the “extreme fear” zone at 24 on March 11.
Capital outflows from spot Bitcoin ETFs continue, with a net withdrawal of $900 million over the past five weeks, indicating that bearish sentiment still dominates the market.
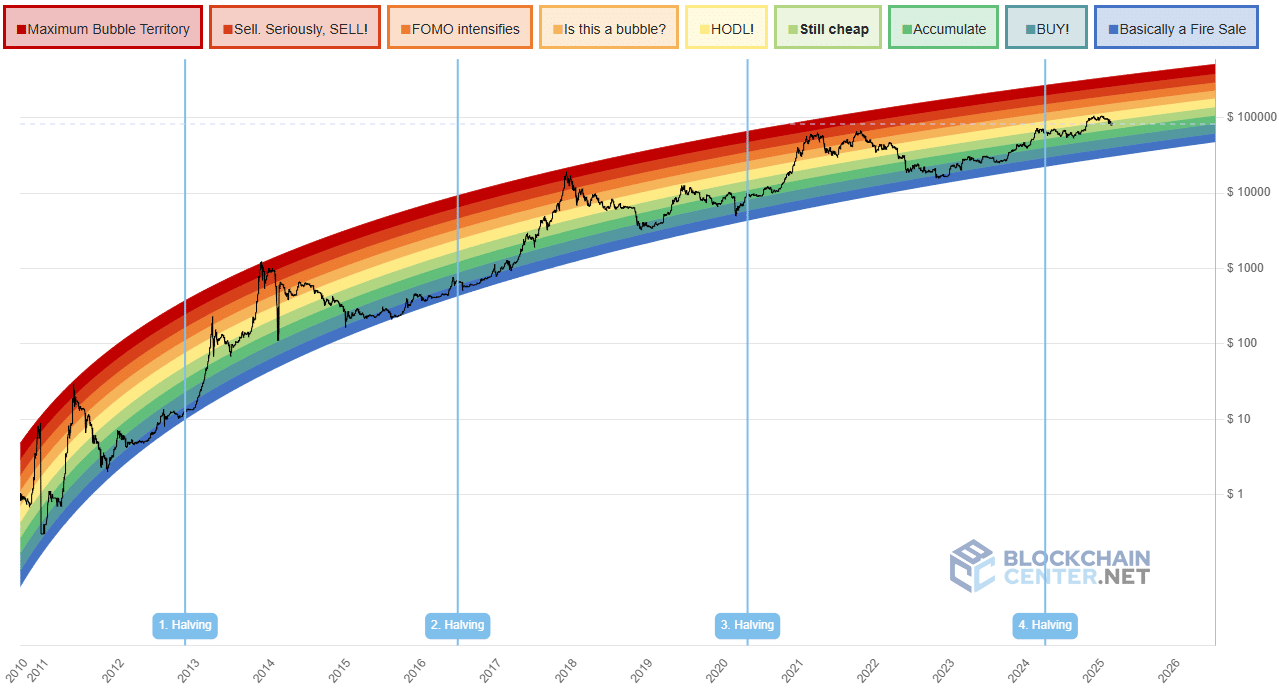
A notable indicator is the Bitcoin Rainbow Chart—a logarithmic model used for long-term valuation. According to this model, Bitcoin is still considered “cheap,” presenting an attractive investment opportunity amid global stock market weakness.

Technical Analysis: Mixed Signals
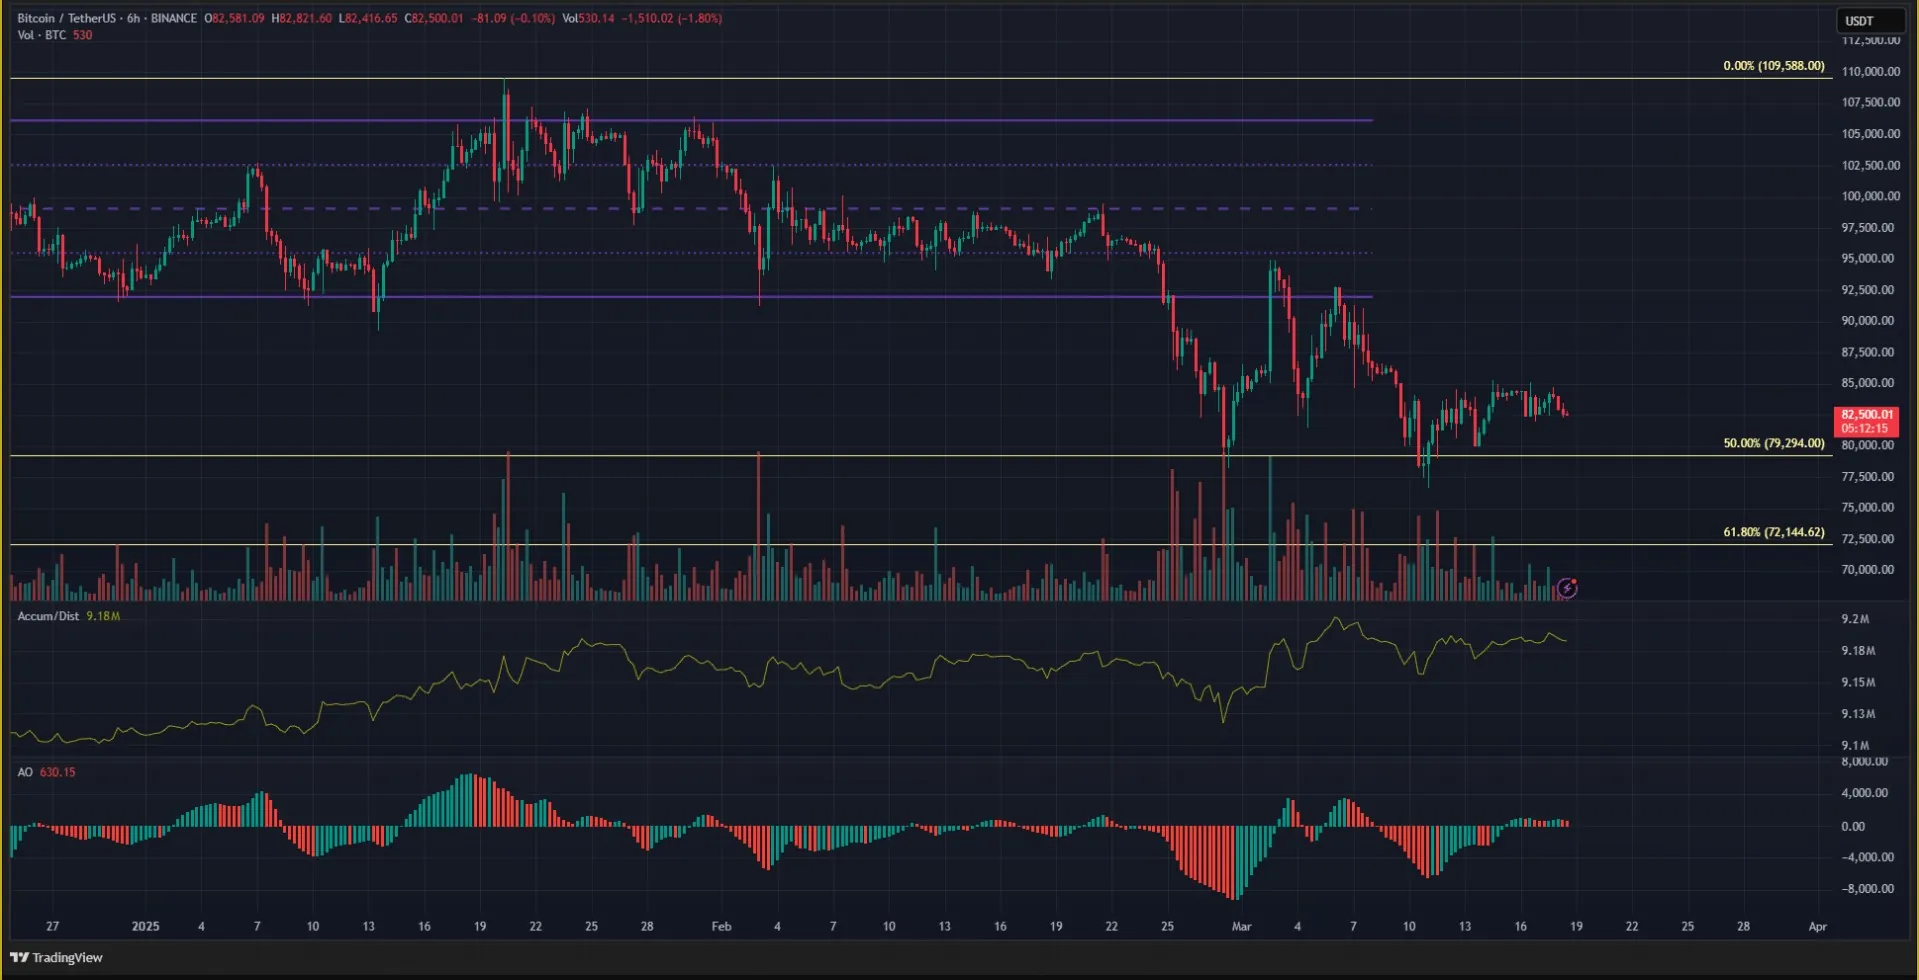
The 6-hour chart suggests that Bitcoin is maintaining a bearish structure. The $85,000 level has repeatedly acted as a key resistance over the past week.
However, the Accumulation/Distribution (A/D) indicator shows increasing accumulation in March, even as the price approaches the $80,000 zone. This suggests that buying pressure is strengthening, signaling a potential recovery.
The Awesome Oscillator (AO) also reflects slight bullish momentum, but not strong enough to establish a clear upward trend.
Meanwhile, liquidation data over the past month highlights two key liquidity zones: the $100,000 level and the $71,700 – $72,300 range. Closer to the current price, the $86,300 and $76,300 levels could attract market attention.

What’s Next: Consolidation or Breakout?
Given the current price structure, the bearish scenario remains valid, especially if Bitcoin continues to face resistance at $85,000. However, if the price breaks above this level and reaches $86,300, the short-term trend could shift bullish before encountering stronger resistance.
Traders should maintain a cautious outlook, favoring a bearish bias unless Bitcoin decisively breaks through key resistance levels.


