Key Market Indicators
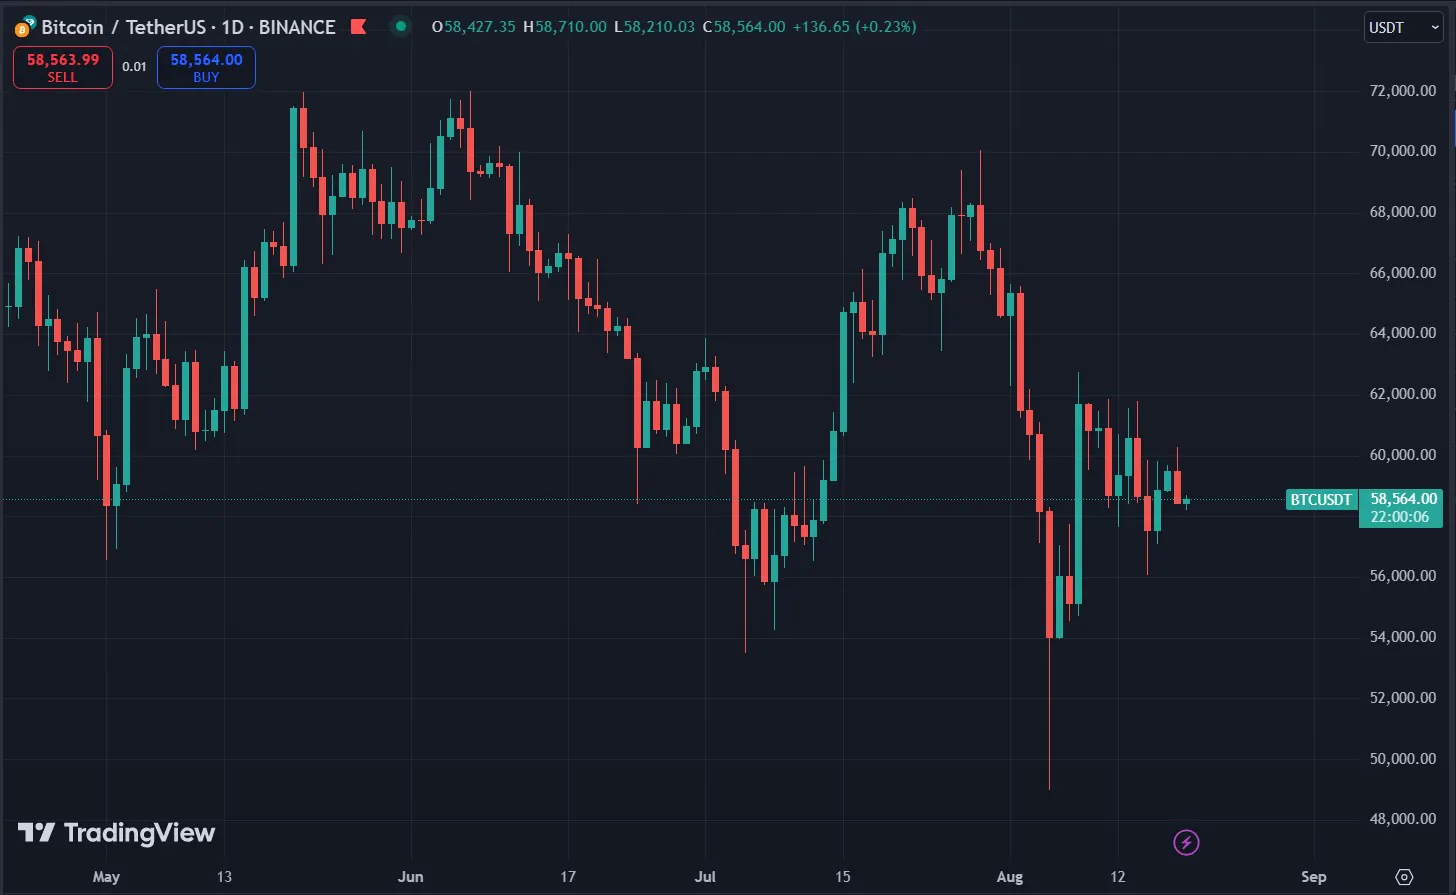
The total market capitalization of cryptocurrencies currently stands at $2.18 trillion, with Bitcoin maintaining a dominant 53% share, according to data from IntoTheBlock. Additionally, the supply of stablecoins has surged to $173.46 billion. However, the persistent lack of significant demand has prevented BTC from experiencing substantial price increases. Since May 21st, Bitcoin has struggled to surpass the $71,500 mark, and a recent sharp sell-off on July 29th pushed its price below $70,000.

Will BTC Break Free from This Stalemate?
Bitcoin has been trading at about 15% below its recent local peak, fluctuating between $56,000 and $62,000 over the past 11 days. Historical precedent from significant price movements suggests that recoveries from local peaks typically take between 40 to 52 days. Given the current downtrend, which has persisted for 21 days since the last drop, BTC might continue to follow this pattern for another 20-32 days unless it achieves a daily close above $62,500.
Bitcoin’s recent price action has been characterized by significant volatility and a formidable resistance at the $60,000 level. While some market indicators suggest a potential recovery, a sustained upward move will require BTC to overcome its current barriers. Investors are advised to monitor key price levels and broader market trends closely to make informed decisions about future investments.


But wanna input that you have a very nice web site, I enjoy the pattern it actually stands out.