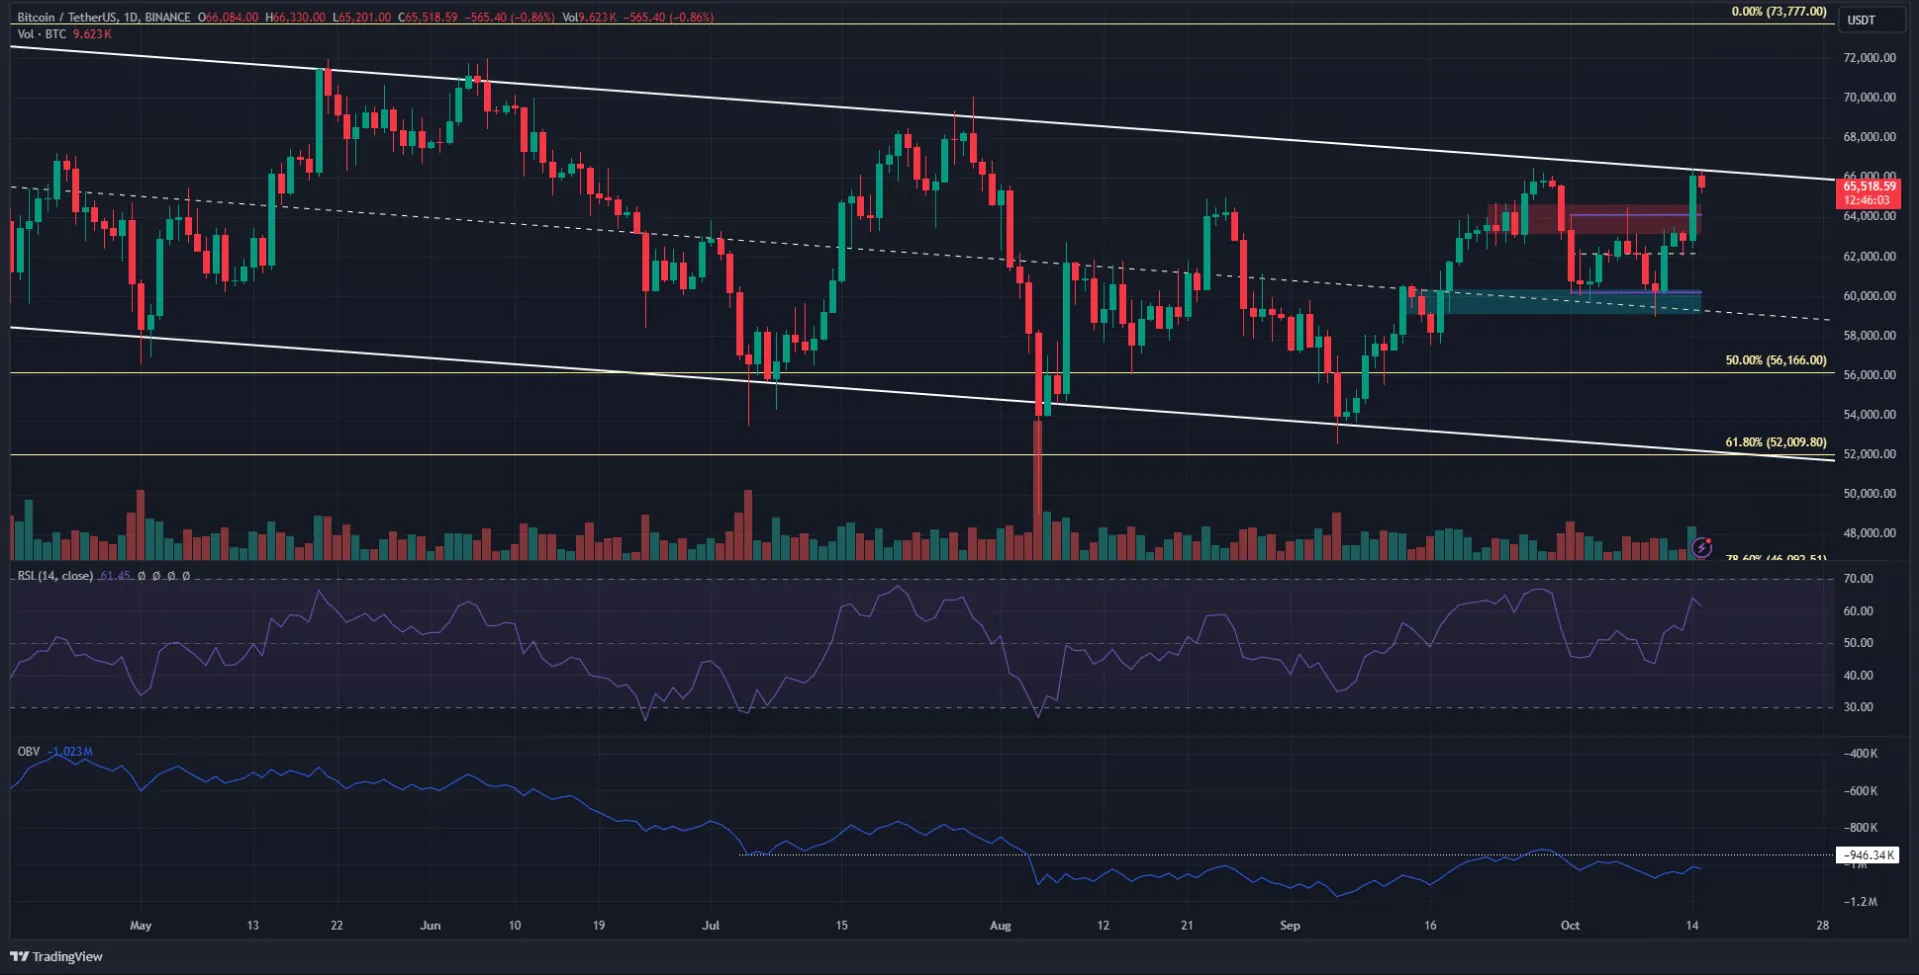
A strong breakout above the $64k resistance level that had stalled bulls’ gains in October occurred on October 14, and channel highs were retested.
Record inflows into Bitcoin spot ETFs may have contributed to the 5.1% price increase. However, ETFs only account for a small portion of total trading volume. Should investors prepare for a strong breakout or another rejection?
Channel Tops vs Range Breakout

In October, BTC traded in a short-term range between $60.2k and $64.1k. Monday’s session saw BTC easily break above the resistance level, but it faced pressure at $66.5k.
This level coincides with the top of the descending channel, which is also the local top from September 27. If the session closes above $66.5k, it will be a sign of a strong bullish momentum.
The OBV (On-Balance Volume) indicator failed to break above the local tops and remains significantly lower, while the price hits the same resistance at $66.5k.
This is a sign that the buying volume in recent weeks is not as high as the sessions where BTC recorded a decline.
Short-term liquidation risk is approaching

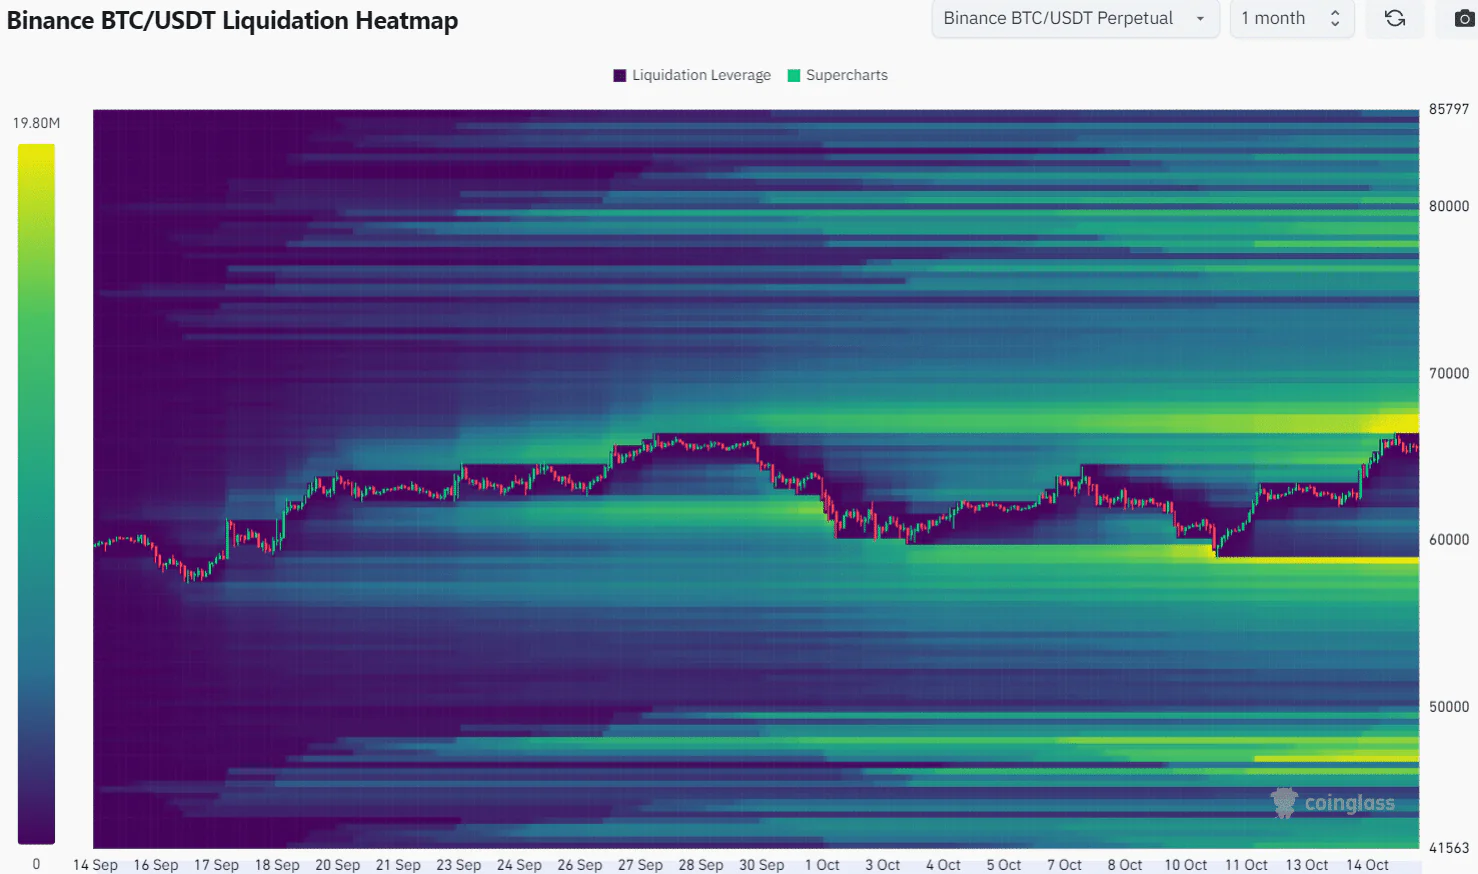
The observation period over the past month shows that the concentration of liquidations is between $66.6k and $67.4k. The nearby liquidity zone could attract the price to move higher before reversing to $60k.
It is unclear whether Bitcoin is ready for the expected growth in Q4 2024, or if it needs more time to accumulate. Based on the liquidation heatmap and OBV, the probability of rejection is high.
A bullish reaction could occur at the old range high of $64k and provide a buying opportunity, but swing traders need to be ready for a deeper correction and manage risk carefully.


