Bitcoin Prepares for a Strong Bull Run
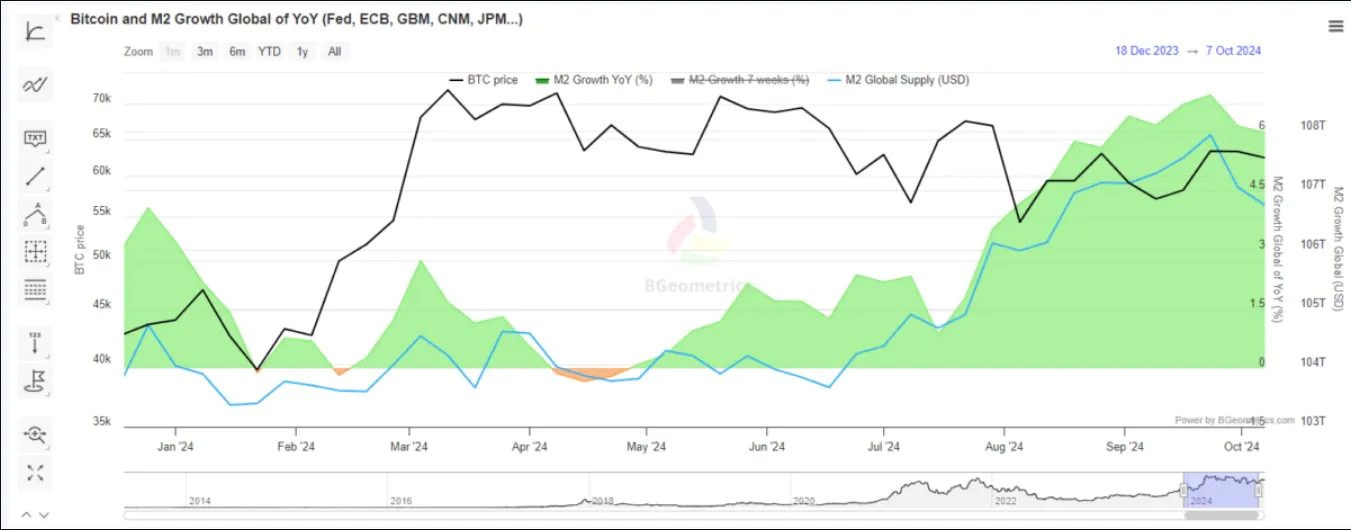
Despite some challenges, Bitcoin appears to be preparing for a stronger rally. Over the past quarter, BTC has been mostly sideways, while global M2 money supply has continued to increase, especially after the US Federal Reserve resumed its quantitative easing policy. Since April 2024, M2 supply has begun to expand again, from 103 trillion to over 107 trillion by the end of 2024.
BTC is still trading in a narrow and sideways range, despite the rapid increase in M2 money supply. Most of the inflows over the past year were concentrated in Q3, while BTC experienced corrections and range-bound trading. Previously, BTC has generally responded positively to increases in M2 supply, as this indicator signals more liquidity, which can encourage flows into high-risk investments.

Currently, BTC is well-positioned to benefit from increased liquidity. Both retail and institutional investors can choose BTC, especially as expectations for continued price increases increase.
BTC did not react immediately to the increase in M2 money supply. One possible scenario is that quantitative easing has not been fully implemented. Previously, after the M2 expansion in 2020, BTC did not react immediately, and the price increase was even delayed for several years, especially after the FTX collapse. In 2024, despite the absence of a similar event, BTC could still benefit from an M2 expansion, but the upside potential could slow down for a few weeks or months.
Bitcoin Price Chart Technical Analysis
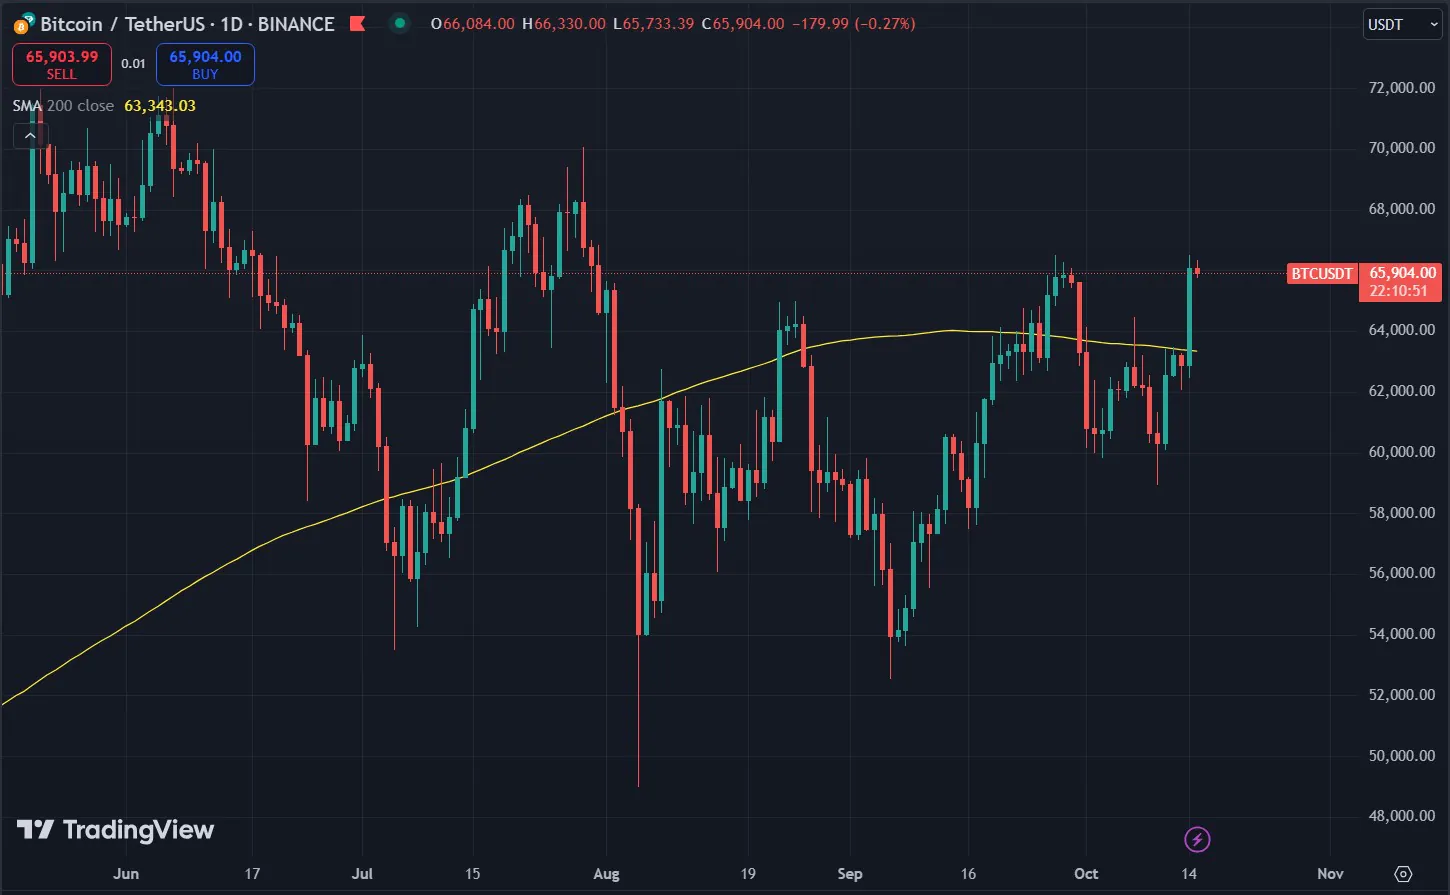
BTC is currently aiming to break above its 200-day moving average (MA). In the short term, there are no clear signs of an imminent major rally, as the 200-day MA has been rejected multiple times in recent weeks.
As of October 14, BTC finally broke above $66,000, trading above the 200-day MA at $63,453.14. This breakout is seen as a signal for a potentially larger upside move.
While the recent price action has broken the previous weak trend, the 200-day MA does not warrant a parabolic rally. BTC broke above this trendline in Q3 but quickly corrected deeper. The question is whether bears will continue to execute their short selling strategy to create strong bearish pressure, forcing the liquidation of leveraged positions.

In addition to short-term price fluctuations, BTC could rally if there are stronger weekly closing signals. BTC’s weekly price is still trending down after falling from the high of $70,000. Since the market top in March, BTC has not been able to make a significant breakout on the weekly price chart to escape the downtrend channel.
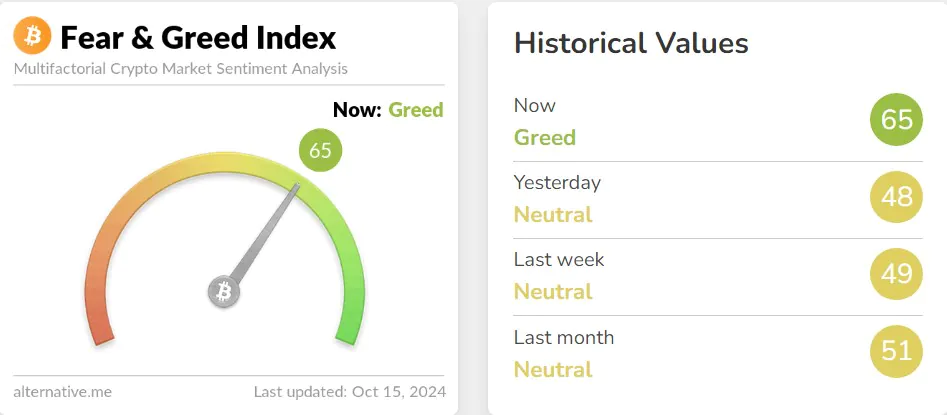
In the short term, market sentiment remains weak, with Bitcoin’s Fear and Greed Index reaching 65, indicating a state of greed. BTC’s dominance in the total cryptocurrency market capitalization has increased to 58%, while expectations for an altcoin season have weakened.

BTC appears poised to break the current trend and enter a true bull market. However, many traders remain cautious, arguing that the recent price action could be a bull trap.
BTC has successfully broken out of its monthly bearish zone, indicating the possibility of a further breakout to higher levels. BTC rallies are typically very fast, taking only about 10% of the market’s trading time to achieve the largest gains. Currently, the coin is 18 months post-halving, a period that typically sees the strongest and fastest rallies.
In the short term, BTC may retest lower levels slightly before attempting to break above $70,000. The upcoming US Presidential election is also seen as a major factor that could spark renewed excitement and create irregular price movements.
According to the Rainbow chart, BTC is still in the “Buy/Accumulate” zone. BTC has fallen much less in this cycle than in previous cycles, but has yet to see a strong rally into the six figures. The halving narrative is still seen as a source of hope to extend the bull market into 2025.


