As of the weekly close on August 25, Bitcoin hovered around $64,000, with analysts cautioning that the recent price surge could be short-lived. The BTC price is struggling to hold onto its gains, and data from TradingView shows that the BTC/USD pair had a relatively stable weekend following a sharp increase during the final hours of the previous Wall Street trading session.
These movements came on the heels of promising signals from the U.S. Federal Reserve regarding potential policy easing in September, specifically the first interest rate cut since 2019.
Initially, Bitcoin’s response was muted, but it eventually surged to a two-week high of nearly $65,000 before pulling back.
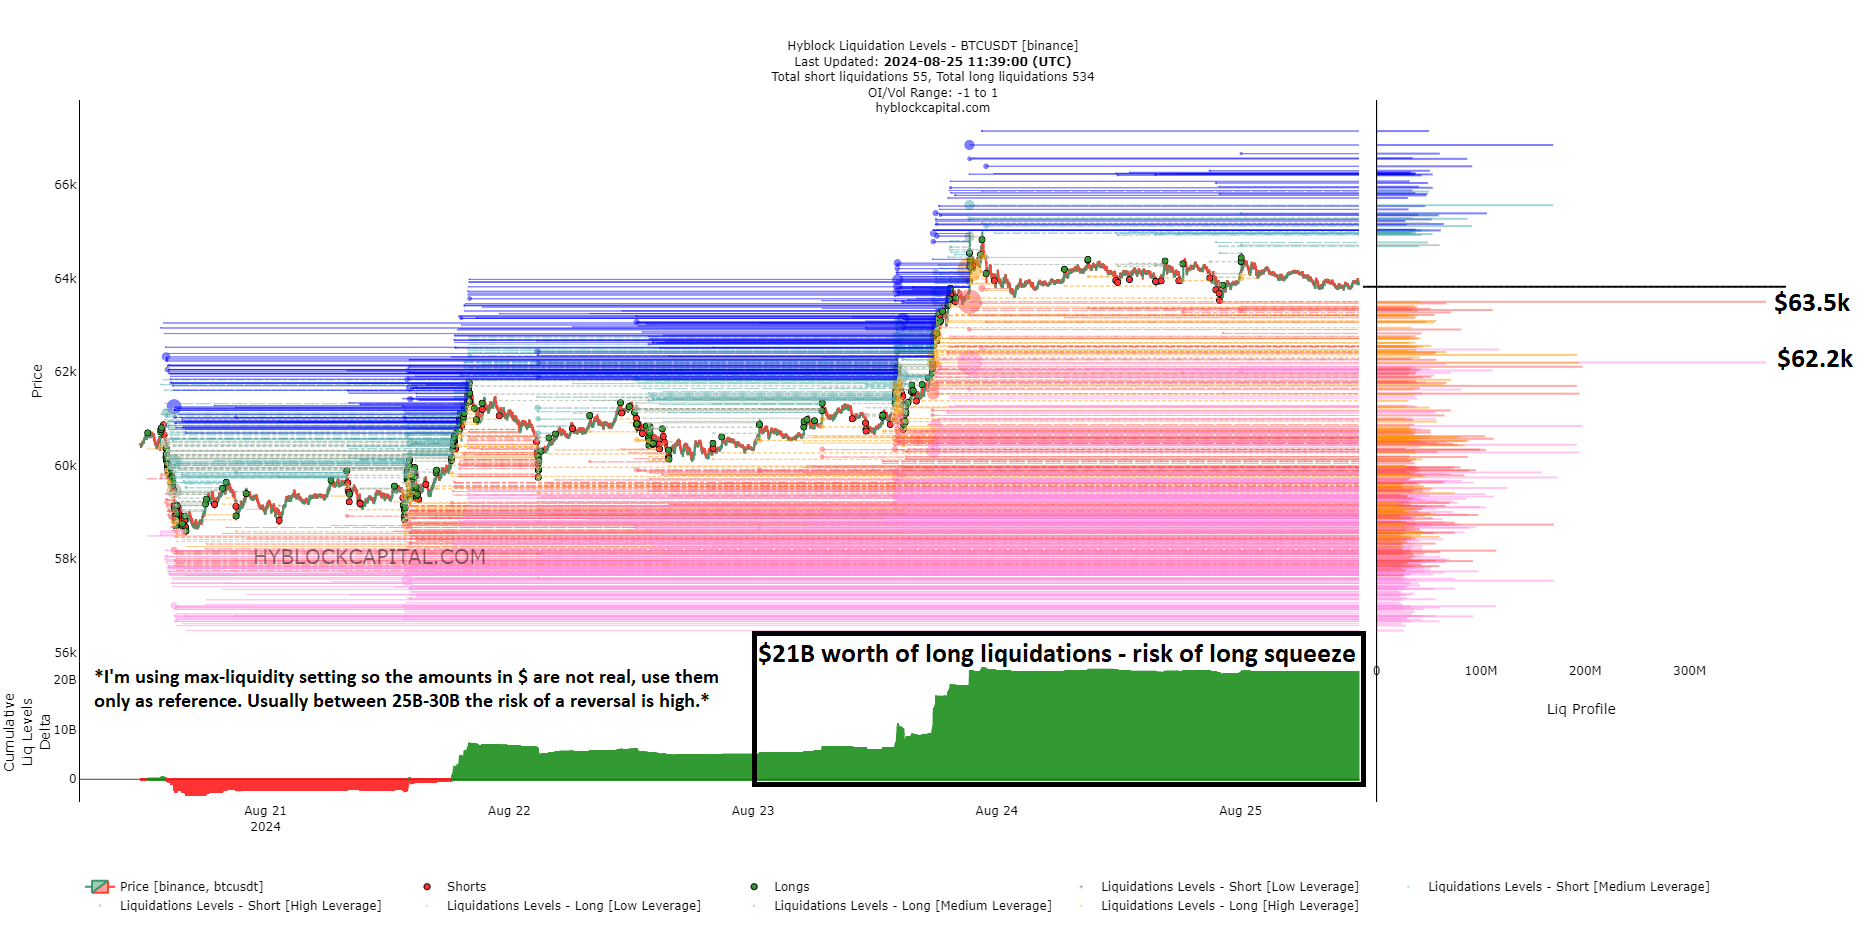
However, as traders evaluate potential moves in the coming days, the well-known trader CrypNuevo expressed caution. In a thread on X, he pointed out that the liquidity in the order book favors a drop to support levels that would trigger the liquidation of long positions.
“The levels with the most liquidation potential are $63,500 (the 50-hour EMA) and $62,200,” he summarized, referring to the 50-period Exponential Moving Average on the 1-hour chart. Consequently, BTC/USD could form a classic “Bart Simpson” pattern, gravitating toward the 50-period EMA on both the 1-hour and 4-hour timeframes.

“This makes sense because they would fill the wick, stop out short positions, and trap some breakout traders,” he explained.
“After that, the decline would intensify delta liquidation activity, with strong pressure toward support levels.”
Other prominent social media traders shared similar views, including Trader ELM, who anticipated a drop to $62,700 before the price could resume its upward trajectory. However, another trader, Crypto Chase, pushed back against this idea on the same day, stating, “Buying ‘clean retests’ like $62.7k after BTC pumps historically has a very low hit rate.”
“When BTC is ready to break out, it RARELY offers clean retests.”
Crypto Chase argued that a breakout above $65,700 would be a clearer signal of bullish momentum, while caution is warranted if the price slips back toward the $60,000 level.
“Let’s see how the price action (PA) responds if the $60K-$61K range is retested,” he wrote, accompanied by a chart for clarification. “This will help determine whether to buy for a retest of another daily resistance at $65K or to short around $57.5K.”
Analyst: Bitcoin Seeks to Return to Norms After Halving

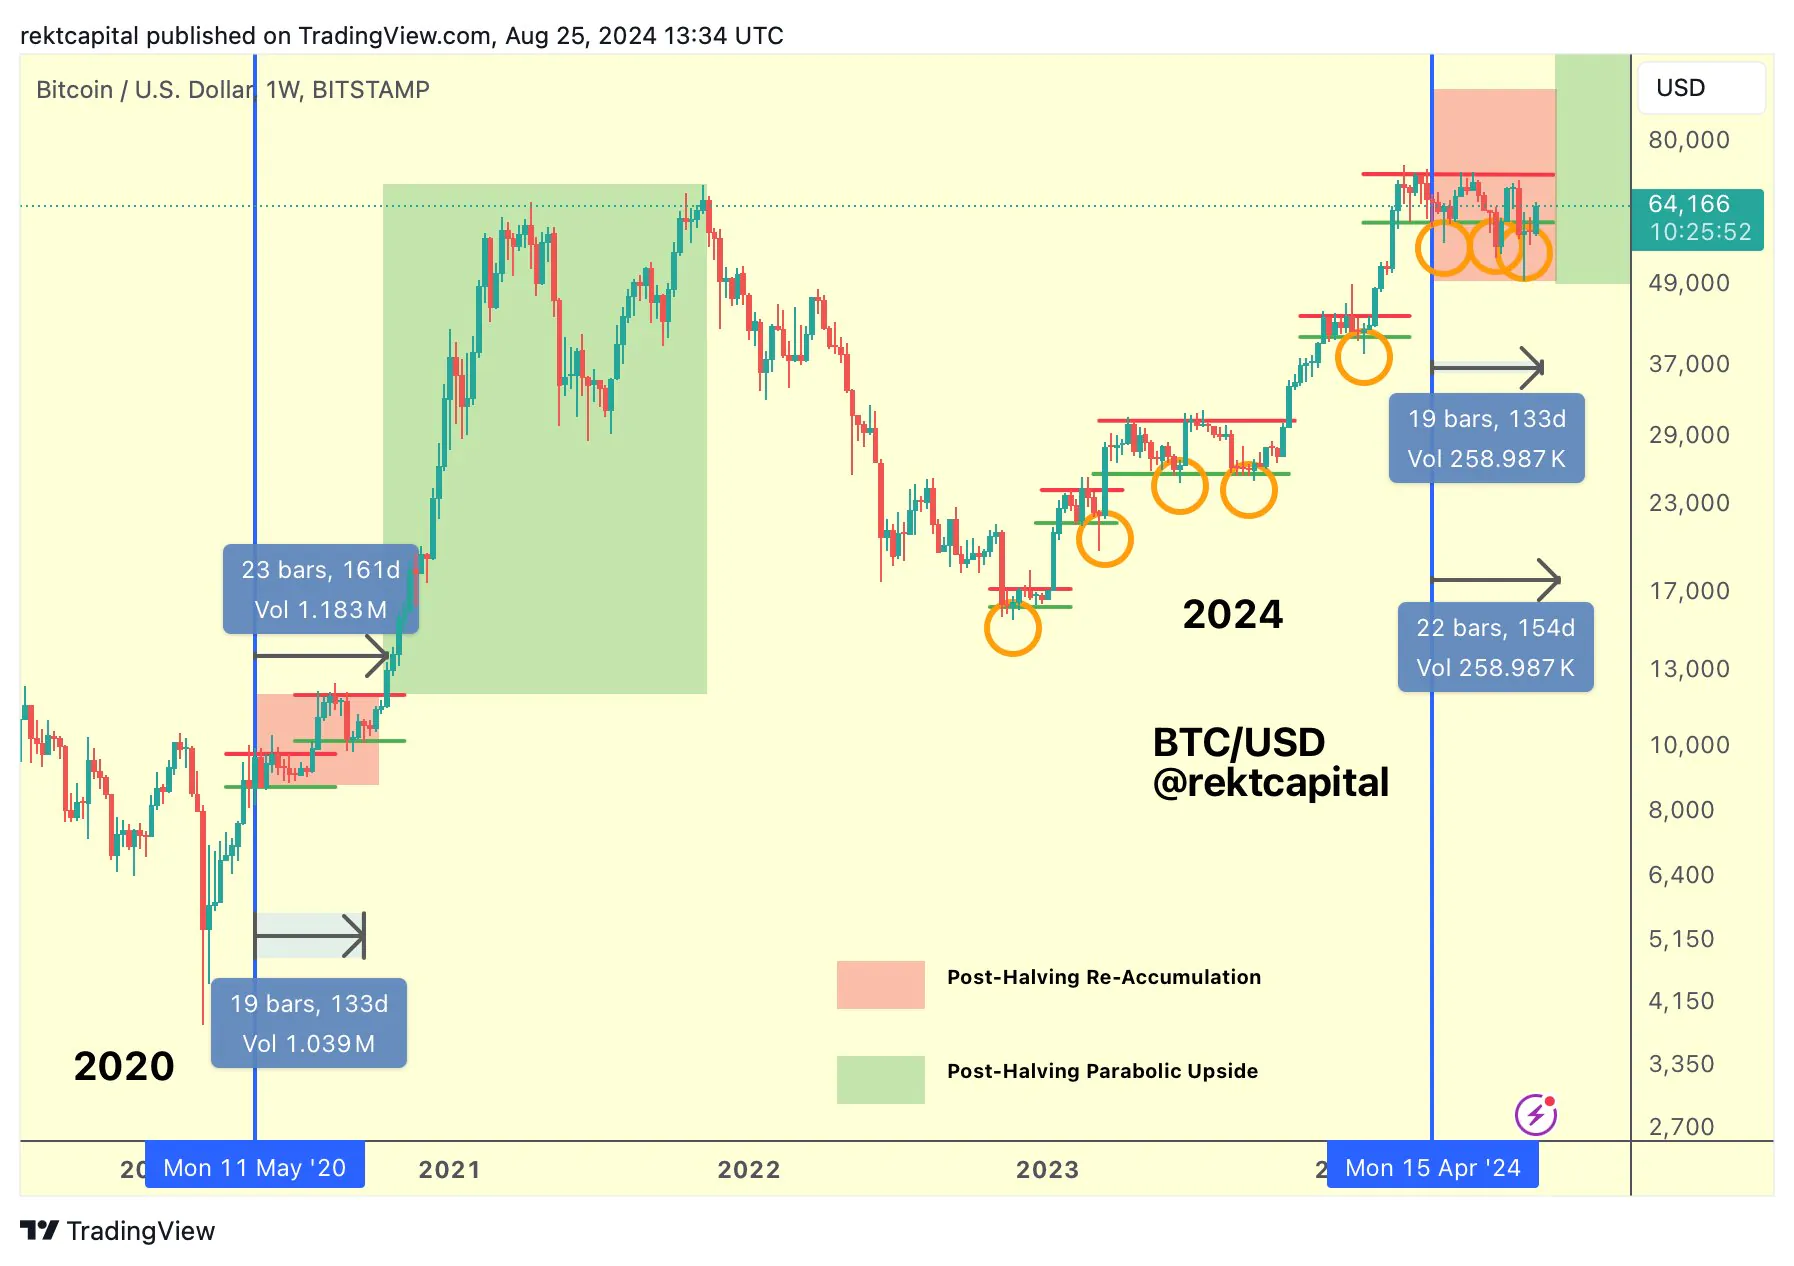
Looking at the broader picture, trader and analyst Rekt Capital offered a more optimistic perspective on BTC’s price performance. He observed that Bitcoin is nearing a reclaim of the range it held prior to the block subsidy halving in April—a period he refers to as the “post-halving reaccumulation range.”
“The significance of this technical event cannot be underestimated,” he argued.
“Essentially, Bitcoin is realigning with its historical price trends following the Halving.” The accompanying chart compared this year’s post-halving price movements with those following the halving event in 2020.


Thanks for the job
Its like you read my mind You appear to know so much about this like you wrote the book in it or something I think that you can do with a few pics to drive the message home a little bit but other than that this is fantastic blog A great read Ill certainly be back