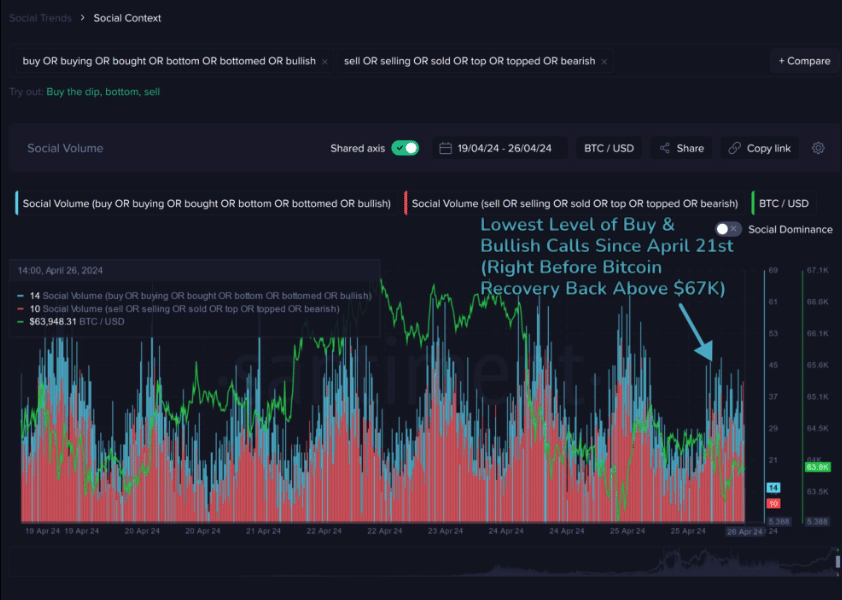
The price of Bitcoin dropped to as low as $62,400 yesterday before rebounding to $63,500 at the current time. According to Santiment’s online social tool, sell orders outweighed buy calls when the price was low. This pattern differed from a few weeks ago when any slight cryptocurrency price drop triggered a wave of price hike predictions.
However, this situation isn’t entirely negative for Bitcoin because peak Fear, Uncertainty, and Doubt (FUD) levels can lead to chart recoveries. In fact, a similar occurrence happened recently, notably on April 21st. On that day, BTC lost value, dropping to $64,500, leading many traders to anticipate further price declines. Contrary to those expectations, Bitcoin surged to reach $67,100.
Source: Santiment
This suggests that such a scenario might repeat if bearish sentiments persist openly. However, it’s crucial to consider possibilities from a data-driven standpoint.
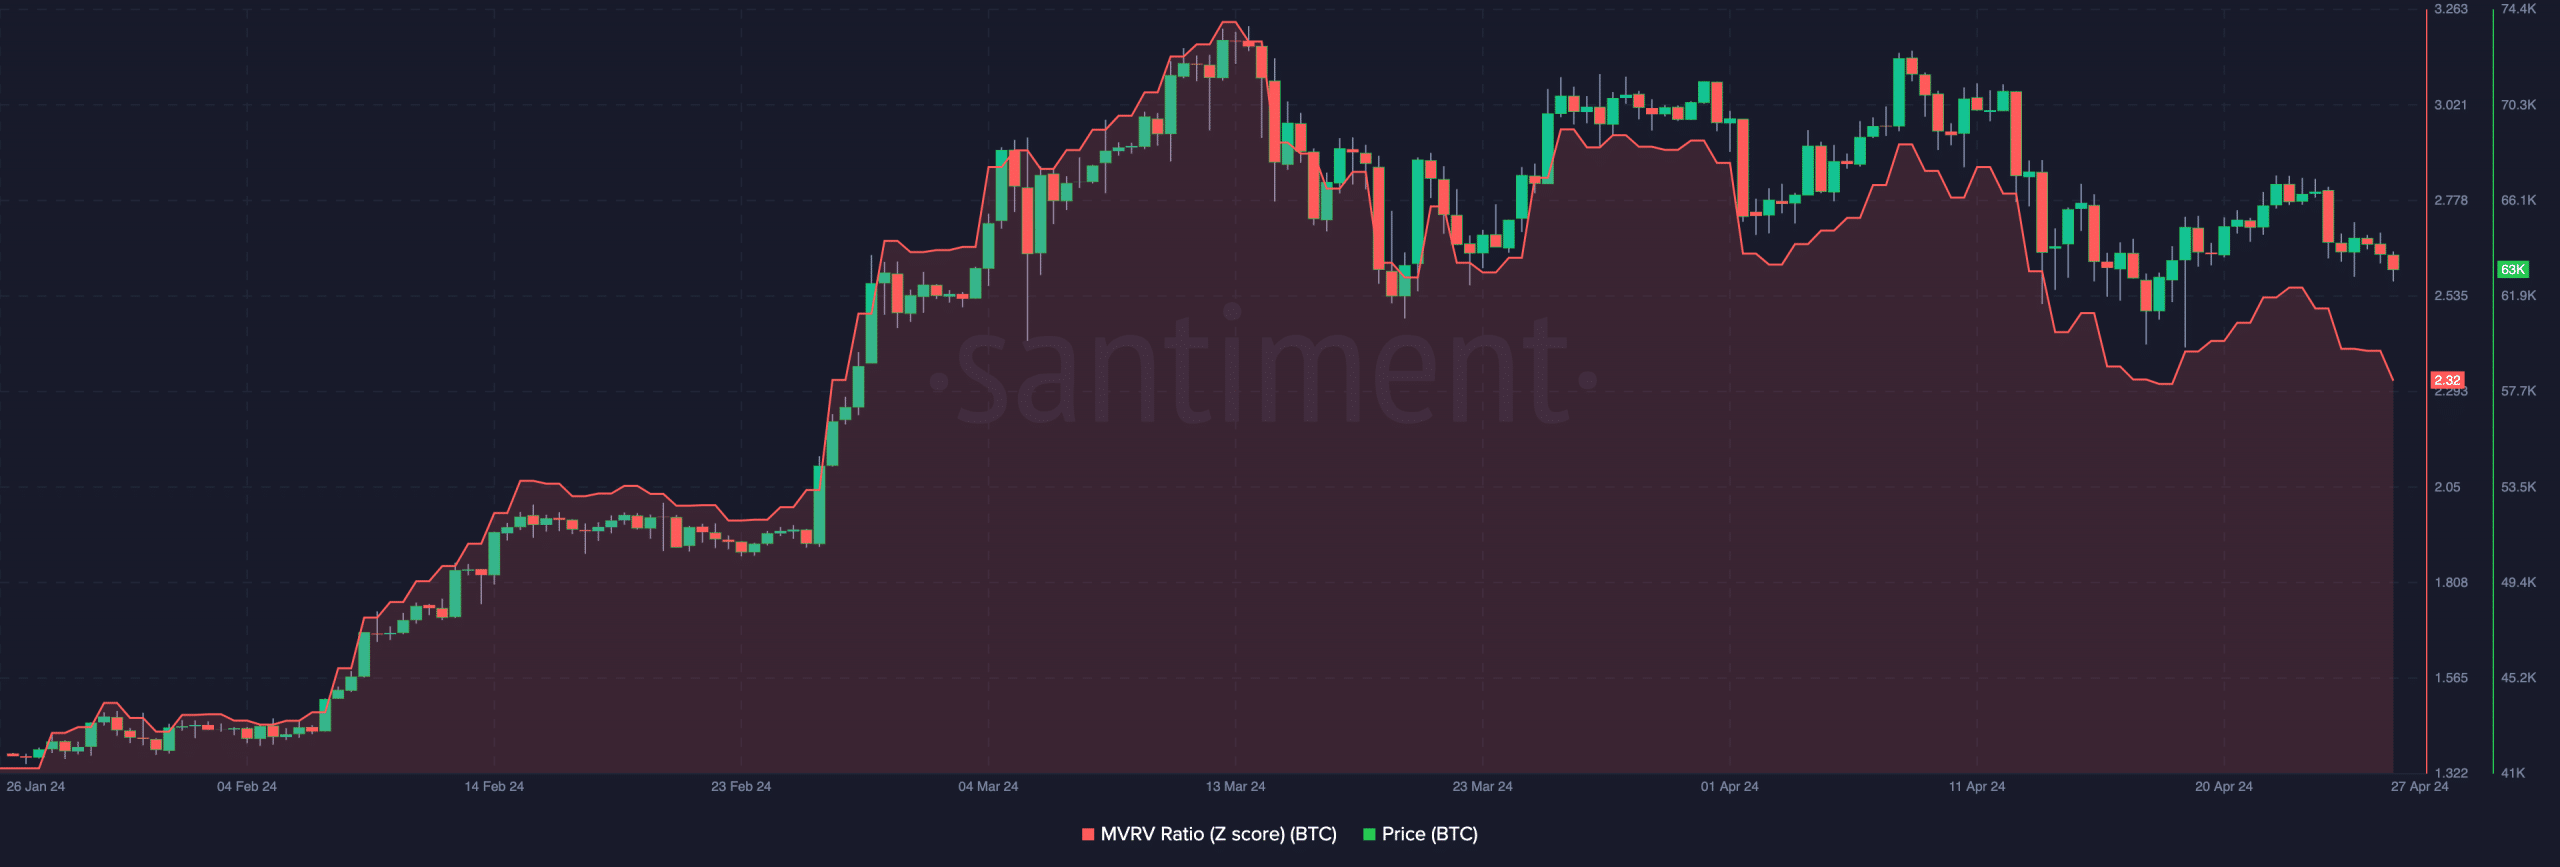
Examining the MVRV Z-Score (Market Value to Realized Value) can pinpoint cryptocurrency bottoms and tops, indicating whether an asset is overvalued or undervalued. Currently, Bitcoin’s MVRV Z-Score stands at 2.32. Looking at the chart, we can observe that since March, Bitcoin has rebounded each time this metric dropped below 2.6.
Source: Santiment
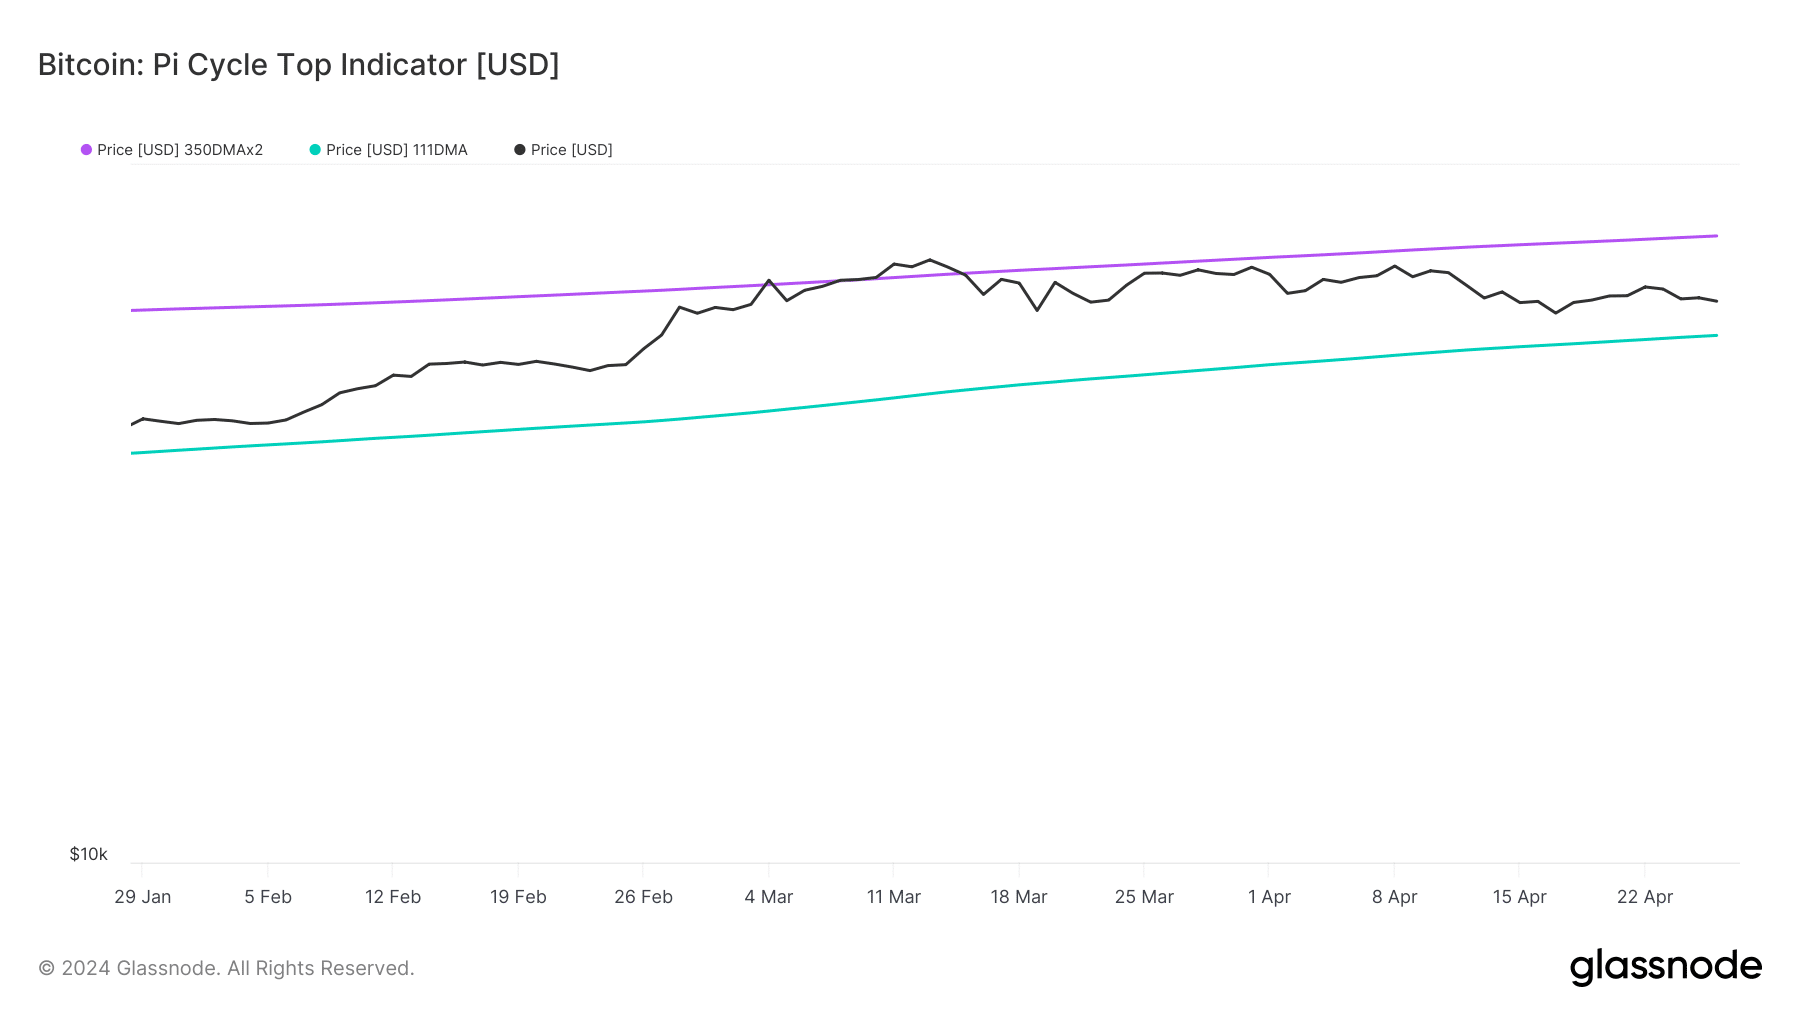
Additionally, the Pi Cycle Top indicator determines when BTC is overheated or vice versa. The green line represents the 111-day Simple Moving Average (SMA), while the purple line represents the 350-day SMA. In most cases, Bitcoin peaks when the 111 SMA reaches or surpasses the 350 SMA. However, this isn’t the case currently as the green line remains below the purple line.
Related: Bitcoin Surges to $64,000, Significant Volatility Looms
Source: Glassnode
These data trends seem promising for Bitcoin investors not only in the short term but throughout most cycles. If the Pi Cycle Top maintains its position in the coming months, Bitcoin may continue to rise, targeting $80,000 to $85,000.


I’m new in this system, that is why I don’t know how I will benefit with this system, please somebody guide me.
Im pakistan
Miss b
Good
Hi