Bitcoin hit a low of $93,400 on February 18 before rebounding to nearly $97,000 at the time of writing. Price movements over the past two weeks suggest that Bitcoin is targeting its next short-term milestone at $99,000.
Despite Trump’s tariffs and the sell-off of spot ETFs, Bitcoin has held firmly above the $90,000 mark.
Analyst Axel Adler pointed out that Bitcoin’s sentiment index is reflecting pessimism. This index takes into account Open Interest, Trading Volume, Volume Delta, and the Volume-Weighted Average Price (VWAP).
A bell curve chart highlights that the most prevalent market sentiment in the past month was 43%. The current level of 31% indicates that sentiment has shifted into an extremely bearish zone. A recovery in this index, with readings above 40–50%, would signal a shift toward a more bullish market outlook.
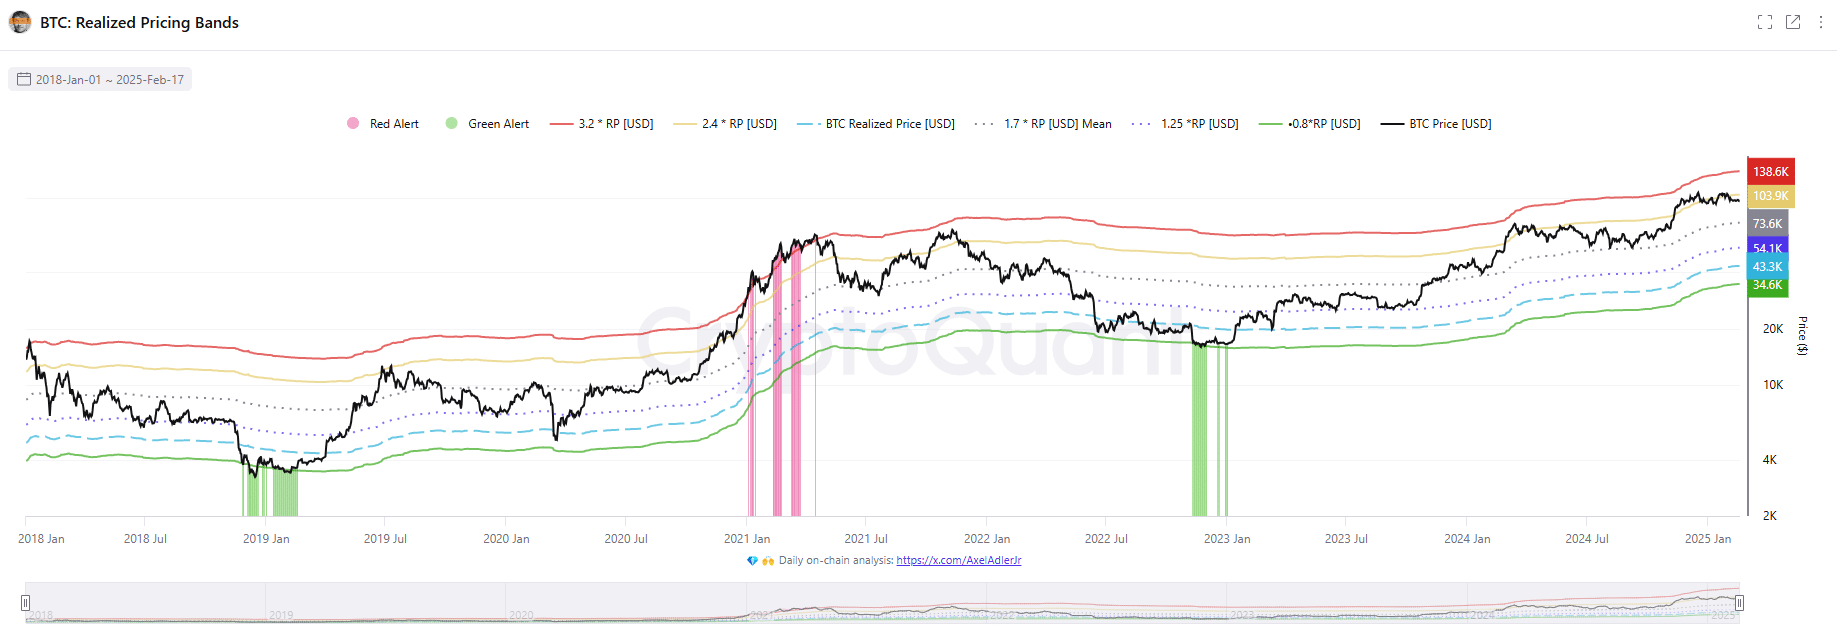
Another indicator, Bitcoin’s Realized Price Bands, suggests that the market is not overextended on higher timeframes. The realized price metric reflects the average price at which investors acquired Bitcoin, offering a potentially more accurate view of the market than the current spot price.

By using multiples of the realized price (RP) and analyzing historical price trends, analysts have mapped out red and green warning zones to mark cycle peaks and bottoms. At present, BTC is closer to the 2.4x RP multiple rather than the 3.2x level. If history repeats itself, long-term holders may look to take profits once prices exceed the 3.2x RP threshold.
According to a recent report by CryptoQuant, over 28,000 BTC ($2.6 billion) has been accumulated by major players in the crypto market. These accumulating addresses include OTC exchanges, large institutional investors, and long-term holders.
This development is bullish for Bitcoin, as more than $2.5 billion worth of BTC has been withdrawn from the market, potentially fueling upward momentum in the coming weeks.


