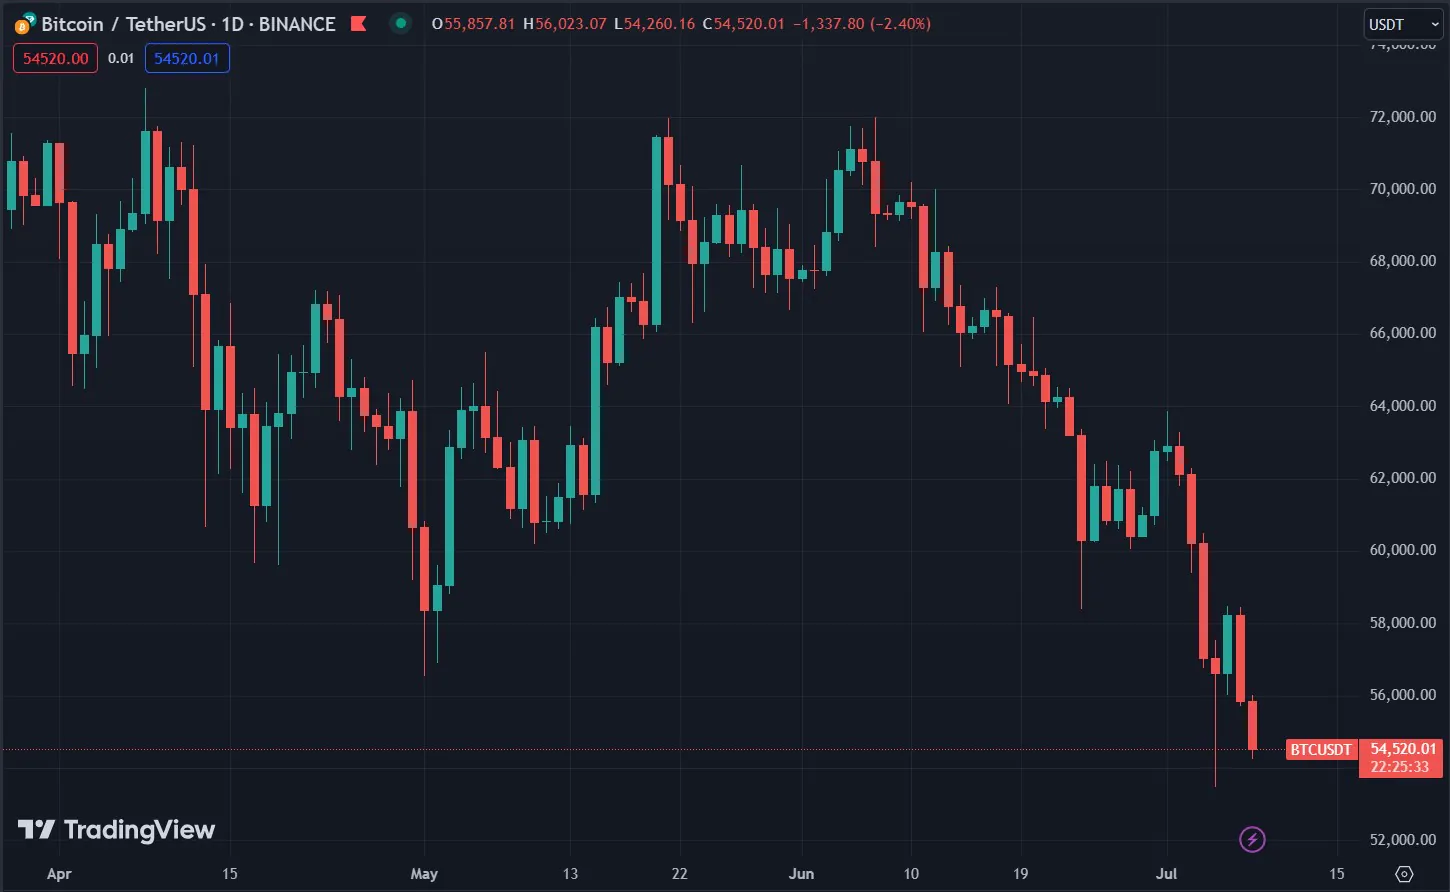
Bitcoin has recently fallen to $54,500, marking a decline of over 10% in the past week. On July 7, 2024, cryptocurrency analyst Benjamin Cowen shared an insightful thread on X (formerly Twitter) discussing Bitcoin’s current position relative to its 200-day Simple Moving Average (SMA). Cowen pointed out that Bitcoin (BTC) is currently below its 200-day SMA, having hit a local low on July 5, 2024. He emphasized that Bitcoin’s performance in the fourth quarter (Q4) of this year largely depends on how quickly it can reclaim its 200-day SMA.

Cowen drew historical parallels to support his analysis. He noted that in 2013, Bitcoin dipped below the 200-day SMA and reached a local low on July 5, before gradually recovering to previous highs and then experiencing a Q4 rally. Similarly, in 2016, Bitcoin fell below the 200-day SMA in August but quickly regained it, leading to a Q4 surge. However, Cowen mentioned that in 2019, Bitcoin dropped below the 200-day SMA in September and failed to recover, resulting in a Q4 downturn.
Cowen suggests that the sooner Bitcoin regains its 200-day SMA this year, the higher the likelihood of a price surge in Q4. Conversely, he believes that the longer Bitcoin takes to reclaim this moving average, the greater the chance of a price decline in Q4, similar to what happened in 2019. He stresses the importance of closely monitoring the 200-day SMA to assess potential market movements.
#BTC is currently below its 200D SMA, with a local low on July 5th. I think the answer to what happens in Q4 this year likely depends on how quickly #BTC can reclaim the 200D SMA.
A thread👇 pic.twitter.com/y8cpKJ0nGI
— Benjamin Cowen (@intocryptoverse) July 7, 2024
Cowen also cautions against over-reliance on historical comparisons, noting that each year has its unique factors affecting Bitcoin’s price. He advises using past years as a reference but not as a definitive blueprint for predicting future outcomes.
The 200-day Simple Moving Average (SMA) is a crucial technical indicator used by traders and analysts to identify long-term trends. It smooths out price data by averaging the closing prices over the past 200 days. When Bitcoin’s price is above the 200-day SMA, it is generally considered to be in a bullish trend. Conversely, when the price is below the 200-day SMA, it is typically seen as bearish. Local lows, such as the one on July 5, 2024, indicate the lowest price Bitcoin has reached within a specific timeframe, potentially signaling a price reversal or support level.
Related: Singapore, Denmark, and the United States Best Prepared for AI
According to Cowen, reclaiming the 200-day SMA means Bitcoin’s price would rise above this average after previously being below it. This is often seen as a bullish signal, indicating a potential upward trend. Cowen’s analysis suggests that swiftly regaining this crucial moving average could lead to a price surge in Q4, while a delay might result in a decline before a potential recovery next year.


