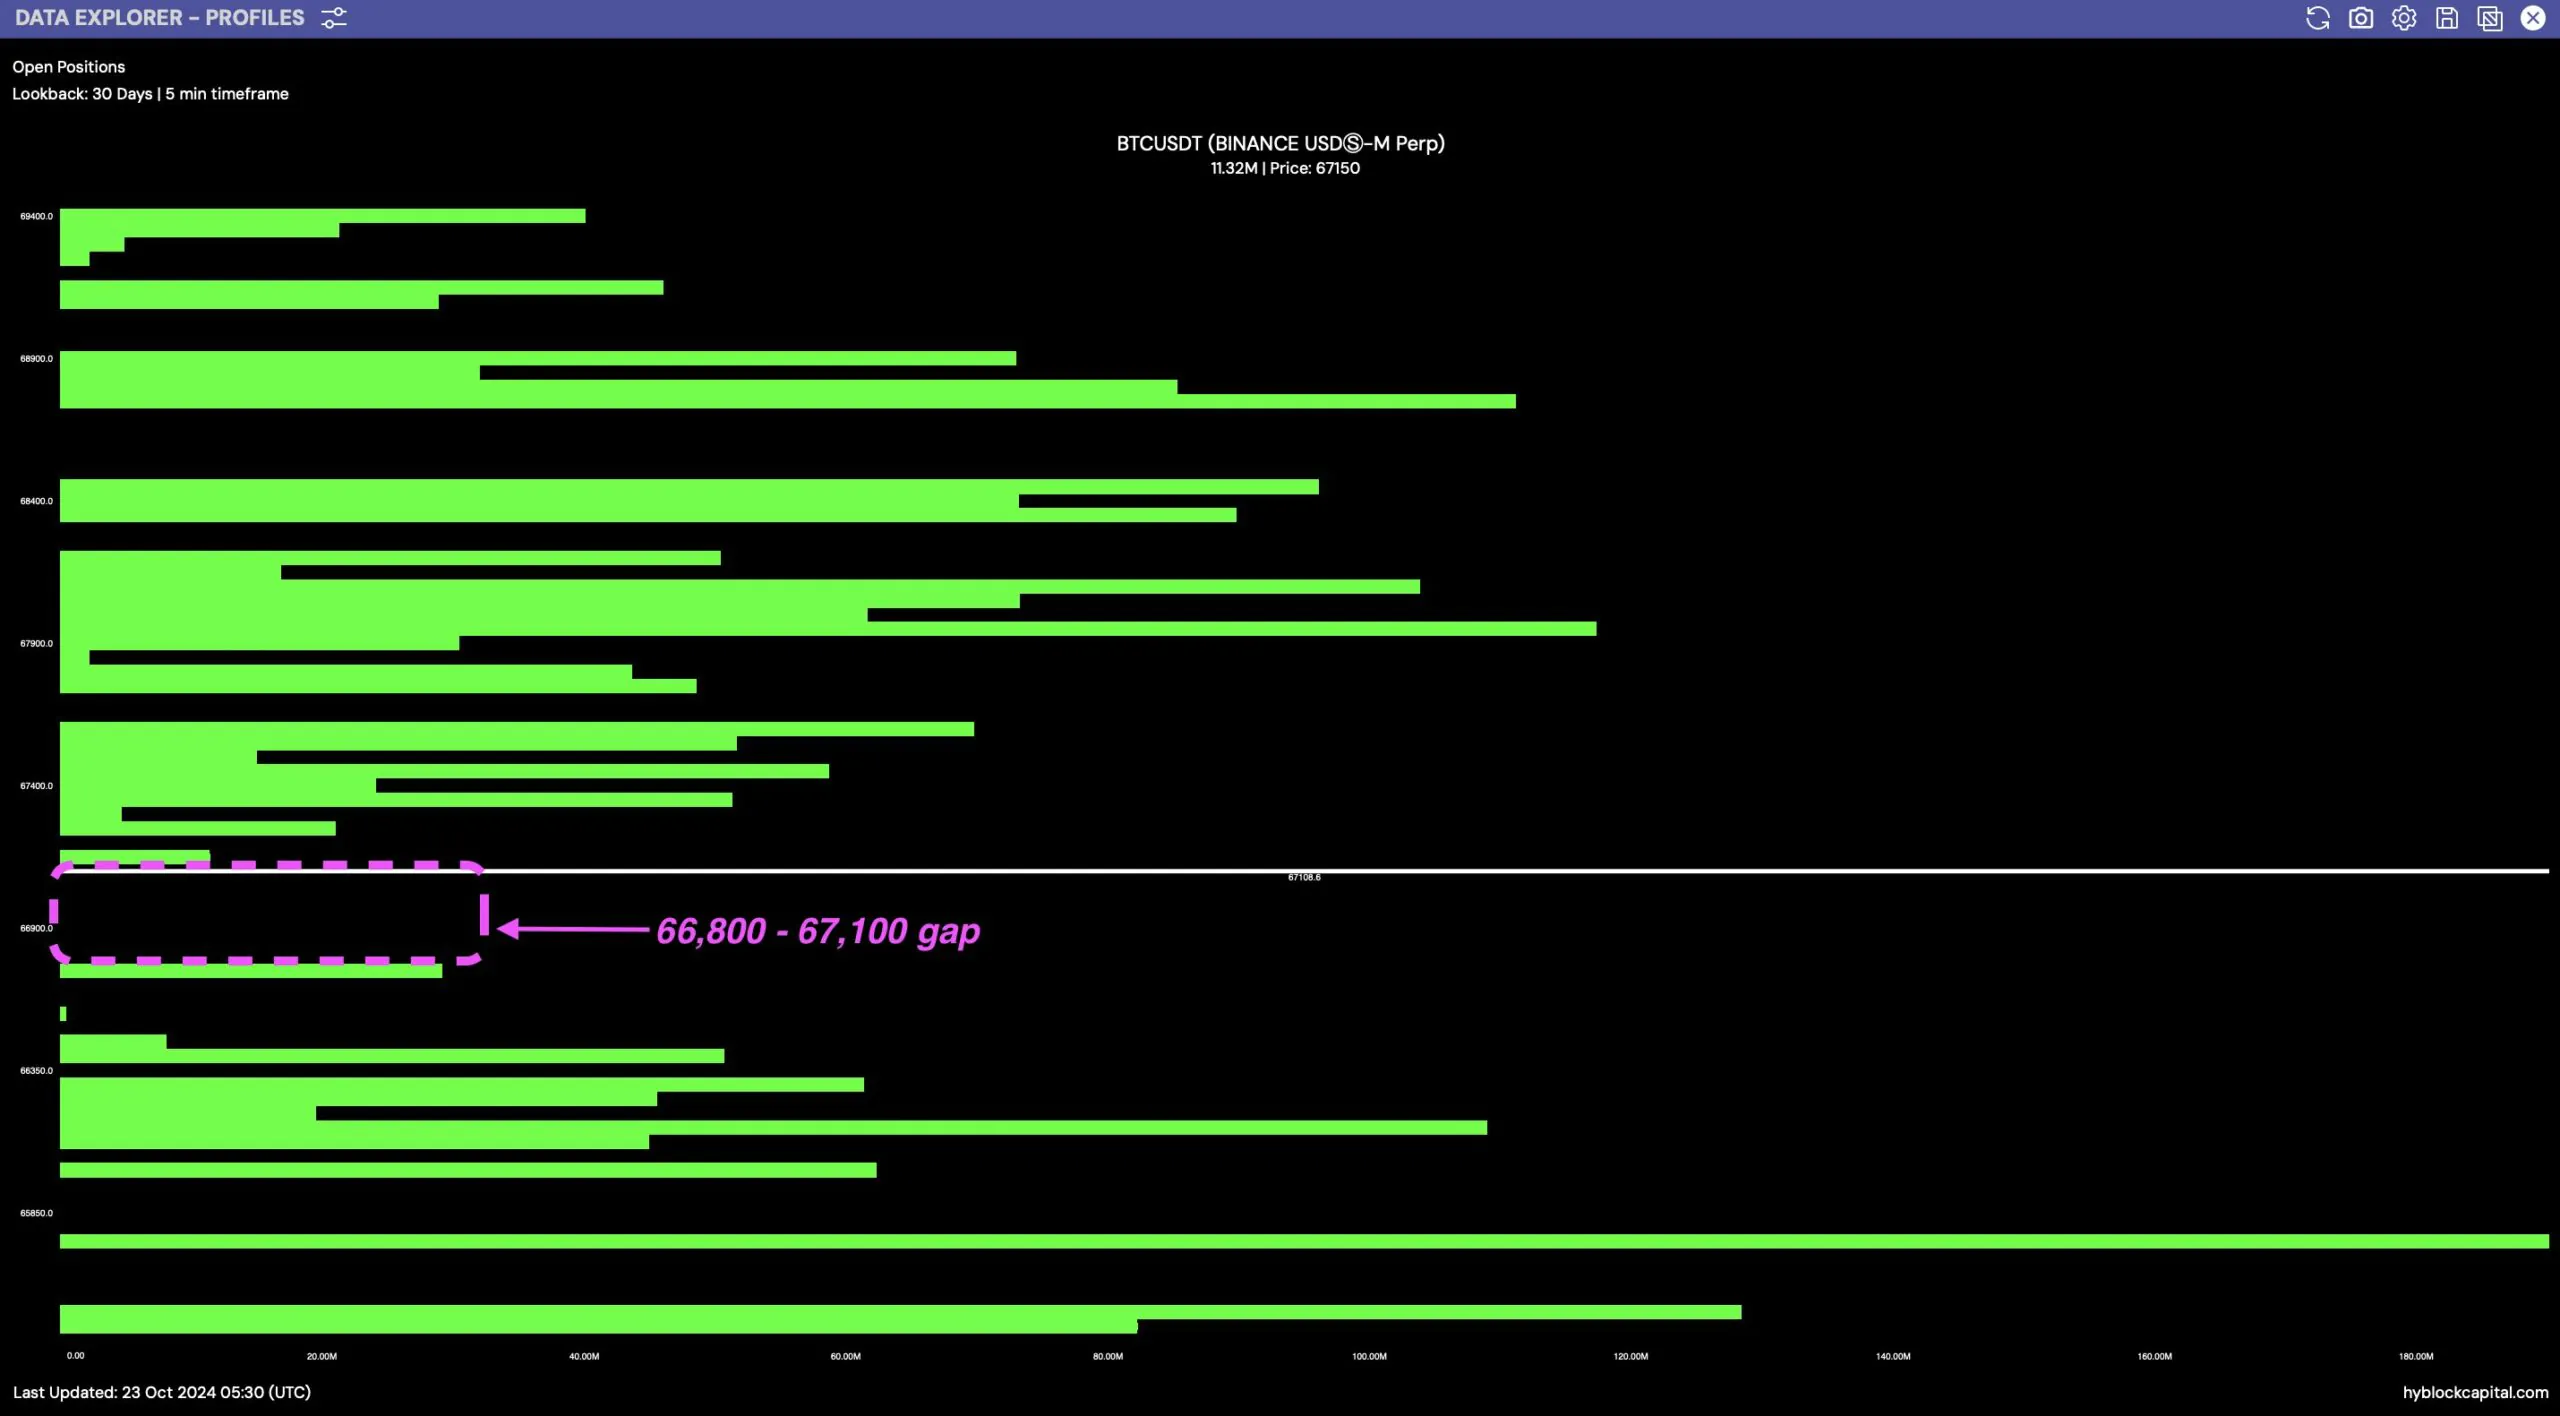
Bitcoin has seen a significant drop in price over the past 24 hours, hitting a low of $65,290 before recovering to its current price. The $66,800 to $67,100 area on Bitcoin’s profile chart shows a lower volume, creating a price gap. Typically, prices tend to revisit these gaps to fill them before resuming their trend. Bitcoin’s next move will depend on whether it fills this gap before moving higher or continues to fall to collect liquidity.
The price action of BTC represents a correction after hitting $70,000 – a significant milestone. This correction will help Bitcoin gain momentum to return to the uptrend, but first it needs to fill the gap in the $66,800 – $67,100 range. This area is located below a key double bottom pattern on the BTC/USDT 6-hour timeframe, reinforcing the upside potential as the gap is filled.

On the weekly chart, the uptrend remains intact, with the price structure broken to the upside, indicating strong support from the market. Traders are closely watching this development, expecting Bitcoin to hold the $70,000 – $71,000 price level, which could trigger a price discovery and a new record high.
The gap filling in this price range could also act as a liquidity draw, helping Bitcoin accumulate more strength before making a decisive move to the upside. A successful break above $70,000 would signal the start of a new bull cycle, with Bitcoin potentially entering a price zone that has never been reached before.
Read more: USDT Market Capitalization Reaches Record High
Bitcoin’s average return index continues to support this outlook. Currently, the index is at 202%, indicating that the current price is more than double the actual purchase price. Traditionally, investors tend to take profits when the index exceeds 300%, but at present, this indicates that the market has not yet entered a period of strong profit-taking. This allows BTC to continue its upward momentum after filling the price gap, with long-term investors still holding on to the possibility of further price increases.


