Bitcoin has dropped to $65,390, marking a nearly 3% decline over the past 24 hours, with trading volume experiencing a slight uptick. Bullish investors in Bitcoin [BTC] are struggling to gain control of the market as the weekly chart for the leading cryptocurrency remains in the red.
However, BTC might have a trick up its sleeve. Recent data indicates that BTC is quietly moving within a bullish pattern, potentially setting the stage for new highs.
Bitcoin targets $127,000
Meanwhile, renowned crypto analyst Gert van Lagen highlighted an intriguing development in a tweet. According to van Lagen, the recent price drop may be due to BTC consolidating within a bullish flag pattern.
The tweet also mentioned that BTC successfully tested a support level. If this holds true, BTC could soon embark on a rally that might propel its price to $127,000 in the coming weeks or months.
BTC’s Next Move

While the possibility of BTC reaching $127,000 anytime soon seems distant, an evaluation of key indicators for the leading cryptocurrency provides insights into its potential short-term trajectory.
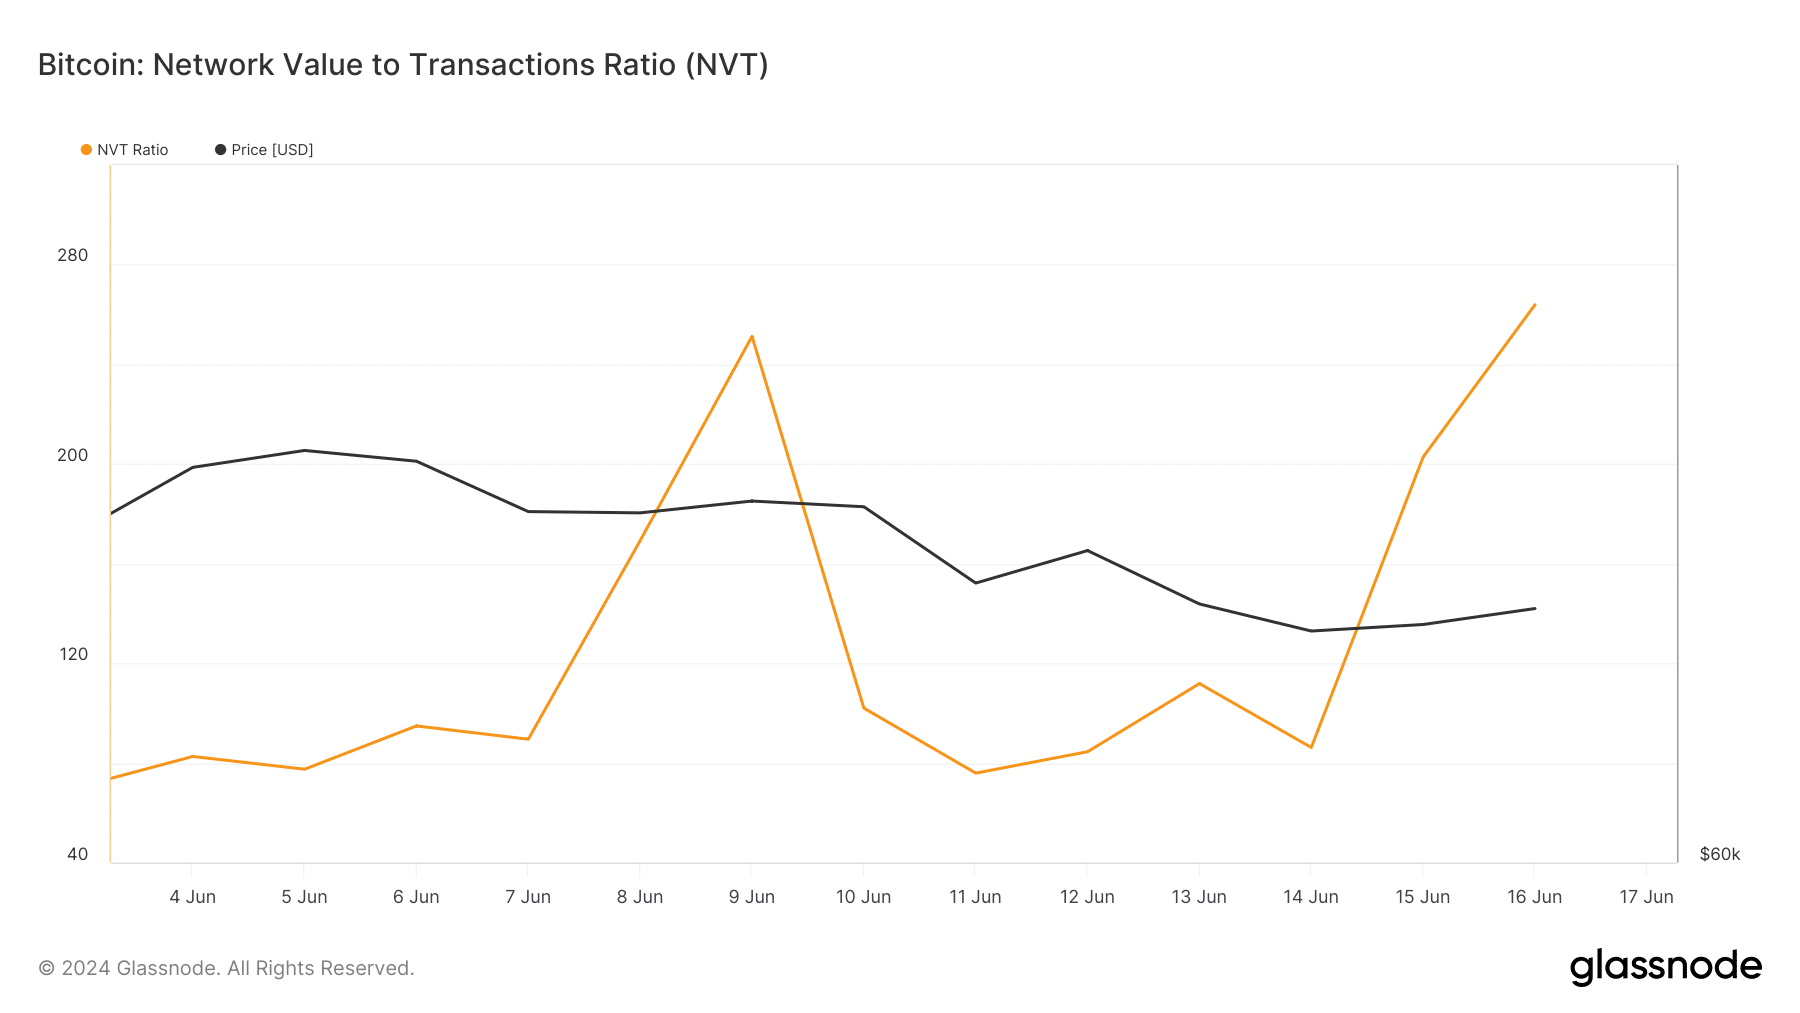
Our analysis of Glassnode data reveals a sharp spike in BTC’s NVT ratio. This increase suggests that the asset may be overvalued, indicating potential price declines in the coming days.

Additionally, we examined CryptoQuant data and found that BTC’s net deposits on exchanges have been higher than the seven-day average, indicating significant selling pressure. BTC’s aSOPR is in the red, signifying that many investors are selling at a profit. In a bullish market, this could indicate a market peak.
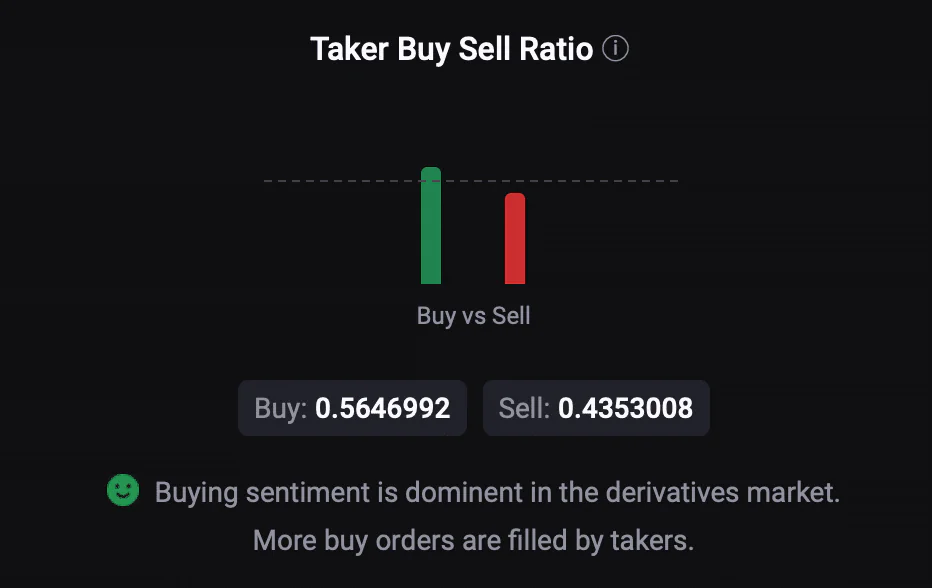
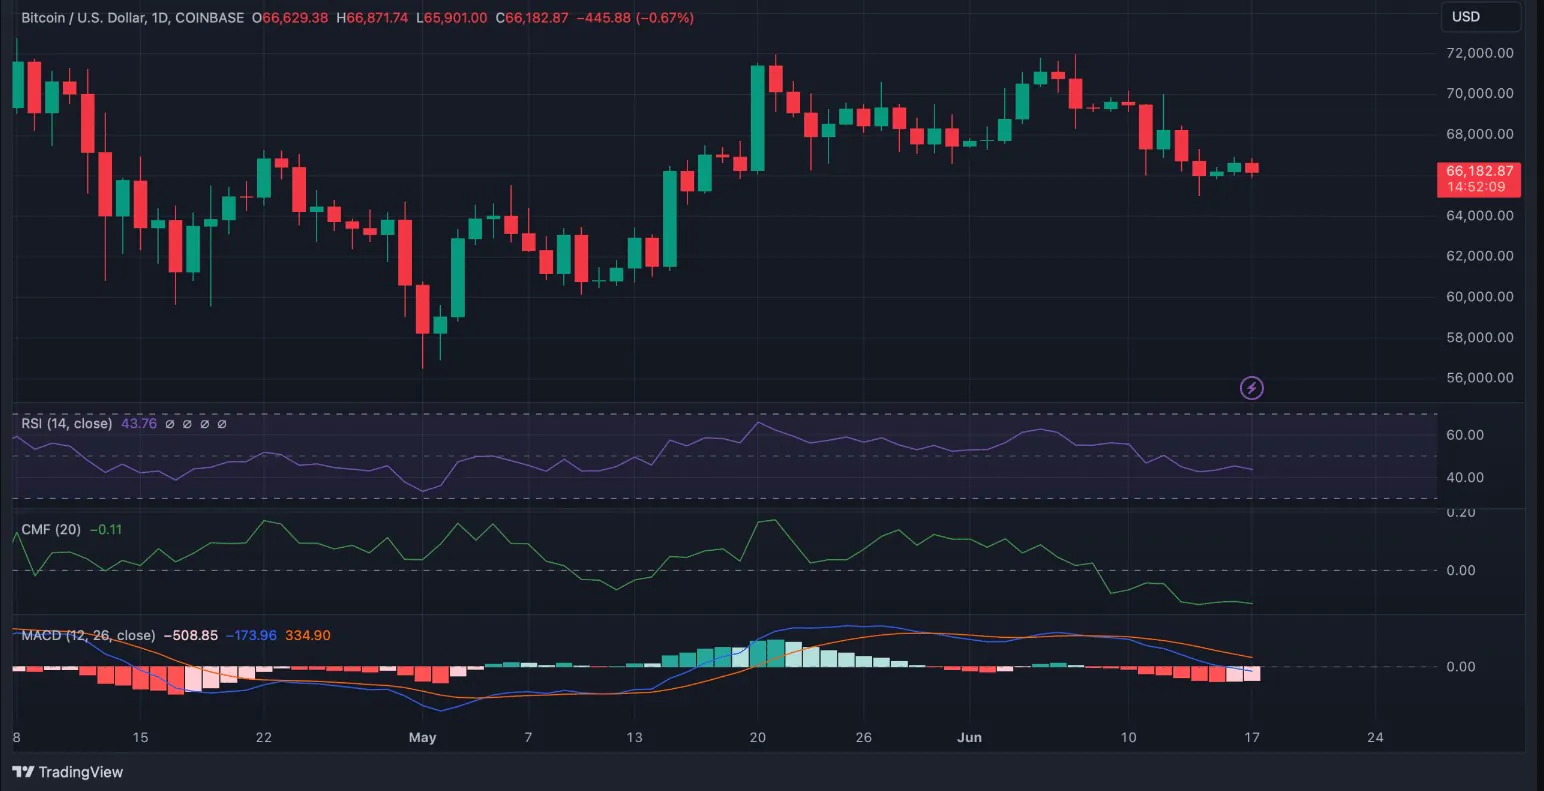
However, the derivatives market appears positive, with the long/short ratio favoring buyers, reflecting a prevailing bullish sentiment among futures investors. Despite this, market indicators continue to trend bearish. For instance, both the Relative Strength Index (RSI) and the Chaikin Money Flow (CMF) for BTC have declined and are below their respective neutral levels.
Related: Binance Lists ZKsync with ZK Token Distribution Program
The MACD indicator shows a bearish crossover, suggesting that the price will likely continue to fall. Analysis from Hyblock Capital indicates that if BTC maintains its bearish trend, investors might see BTC hit the $65,000 mark this week.

A significant drop below this level could push BTC down to $60,000 in the coming days. Conversely, if BTC shifts to a bullish trend, it could first reach $67,650.


Adamu