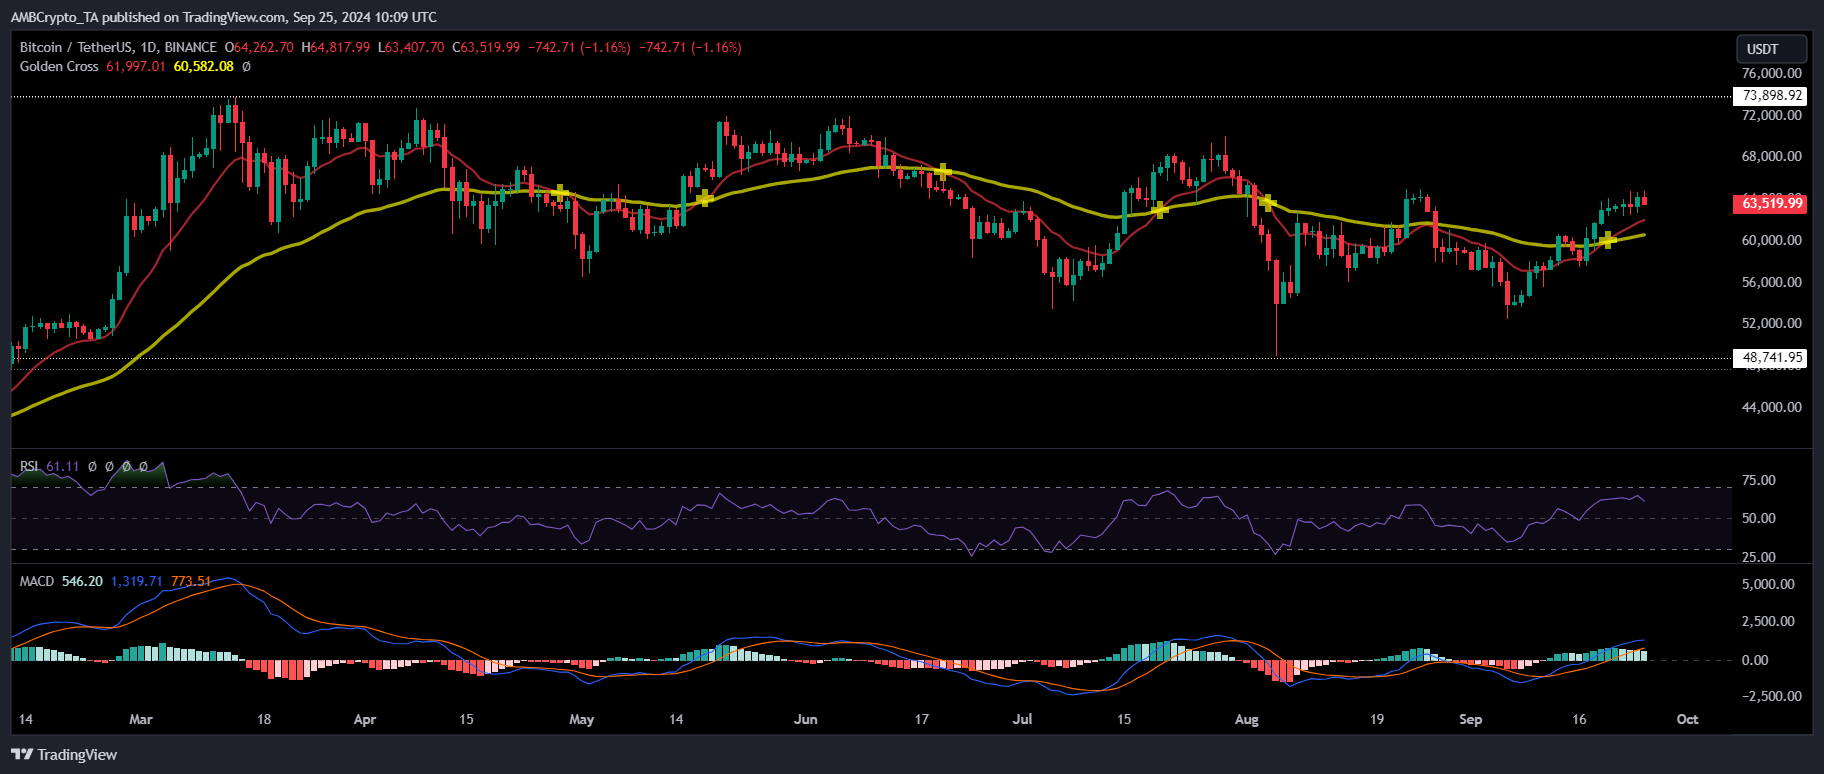
The level has been tested several times since Bitcoin hit its all-time high (ATH) of $73,000 in March. By August, bears had reasserted their control, preventing a breakout to $68,000.
Bitcoin’s Golden Cross Requires Long-Term Sustainability

On the daily price chart, Bitcoin’s 50-day moving average (50 DMA) crossed above the 200-day moving average (200 DMA), forming a Golden Cross pattern.
Historically, this is a reliable signal to watch for Bitcoin’s trend. When a short-term moving average crosses above a long-term moving average, it typically signals a strong bullish move.
Notably, in the final week of the August cycle, the short-term moving average almost crossed above the long-term moving average, signaling a possible bullish move.
However, a resurgence in short positions prevented the moving averages from crossing over, resulting in a sharp rejection and a pullback to the $55,000 support level.
If this scenario repeats, the trend could turn into a “Death Cross,” signaling a bearish market. So what needs to change?
Curbing Bitcoin Short Positions Is Key
Typically, traders view the “Golden Cross” as a buy signal, expecting the price to rise in the future.

Whenever Open Interest (OI) surges, it often coincides with Bitcoin testing key resistance levels.
Simply put, whenever the market reaches a peak, it typically sees a significant increase in futures traders buying. However, this boom usually ends with investors closing their positions, leading to a sharp decline in the value of BTC.
Surprisingly, while Open Interest reflects these market peaks, BTC prices do not follow suit. This could indicate a resurgence in shorts.
As Bitcoin bulls enter their fifth day of trying to push the price above $65,000, a large amount of new long positions have emerged.
However, if shorts remain dominant, the liquidation of long positions could trigger another decline, potentially dragging Bitcoin below $60,000 before the next breakout attempt.
This Correction Could Make a Difference

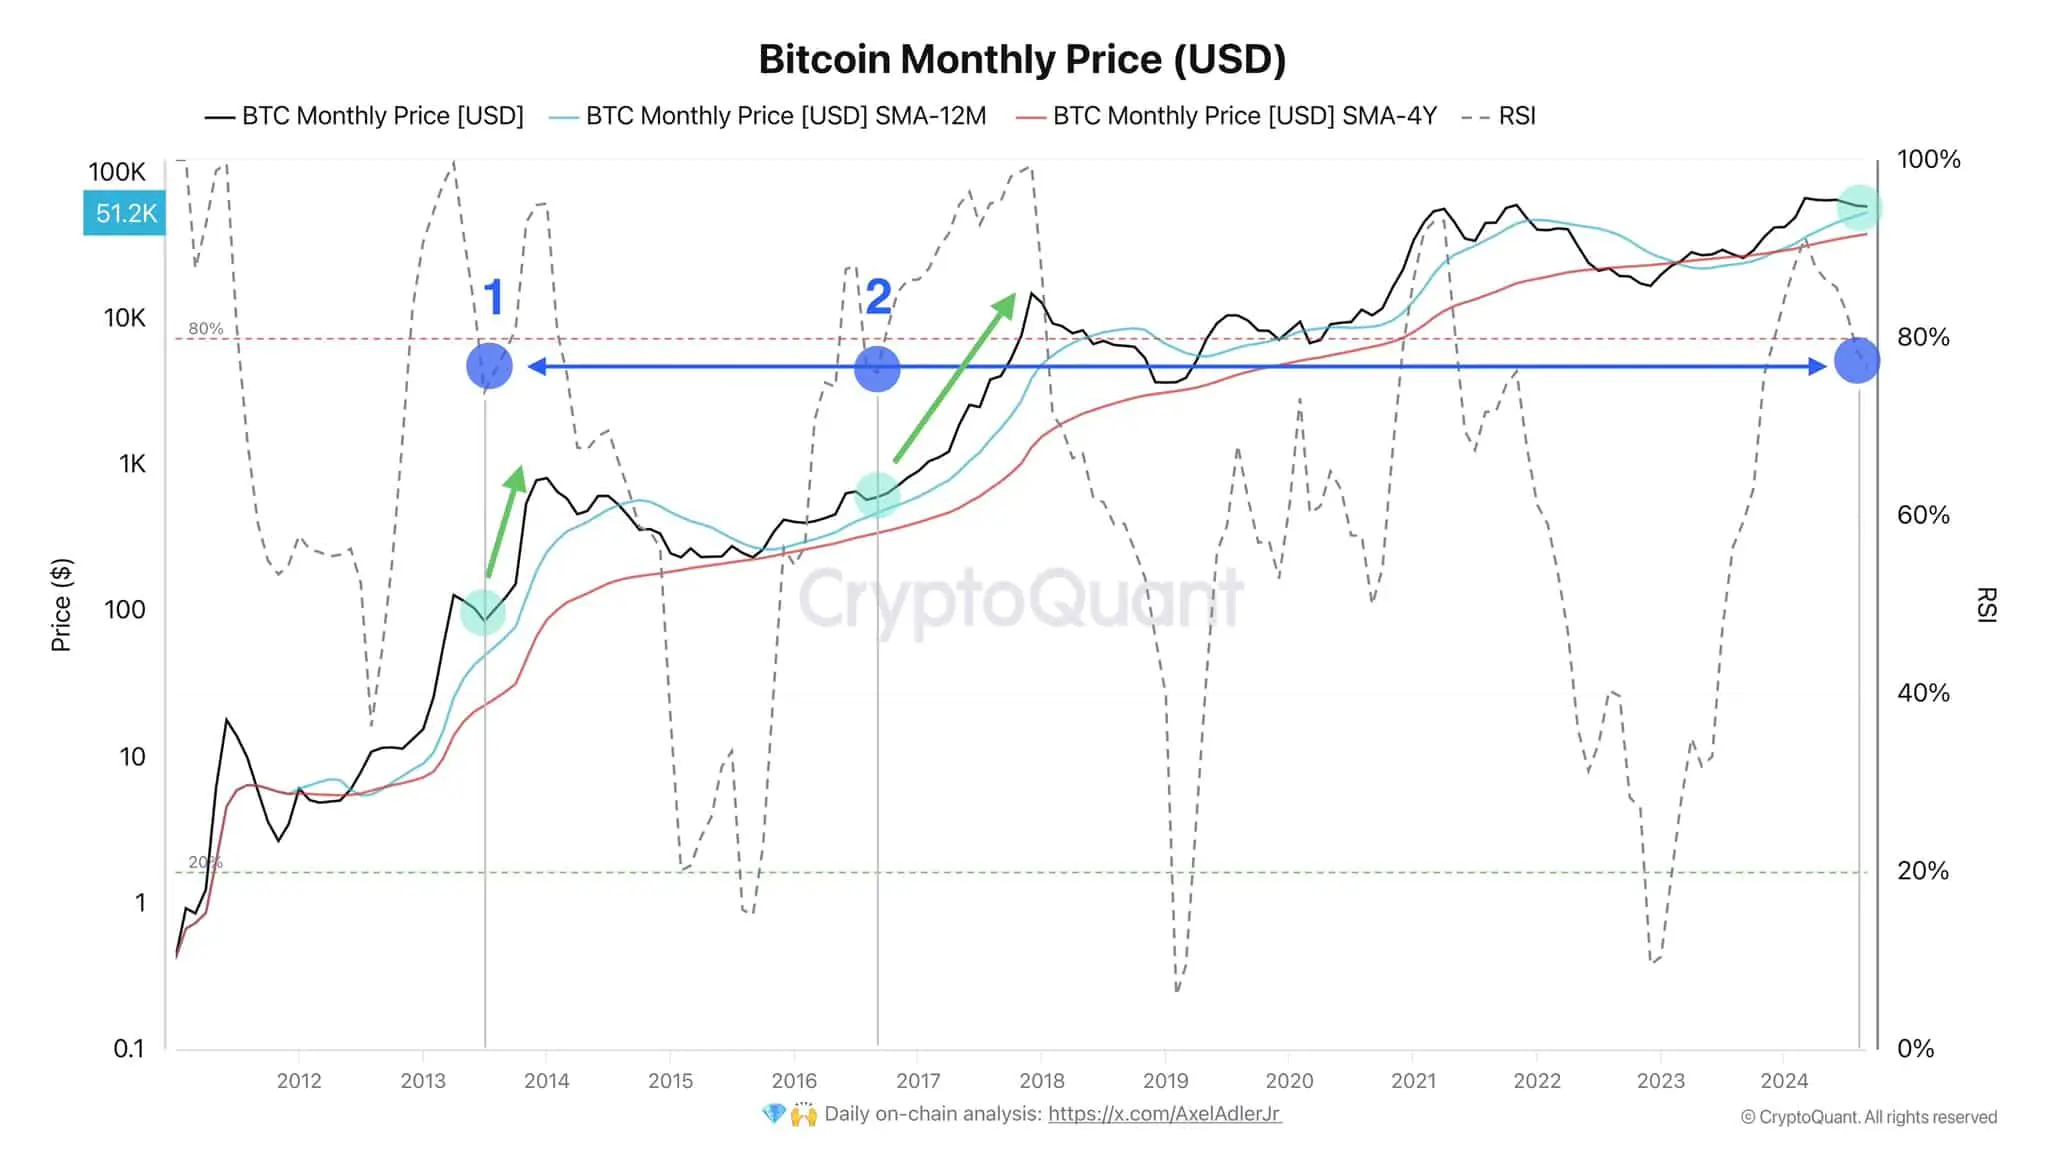
On the monthly timeframe chart, the RSI has dropped below 80%, suggesting that Bitcoin is preparing for a short-term price correction. Typically, when the market is oversold, it often attracts new buying interest.
According to historical analysis, when the RSI drops during a bull cycle, it usually signals a bullish correction, creating an opportunity for investors to buy at a more attractive price.
While this situation could create conditions for a “Golden Cross” pattern to appear in the near future, for the market to stabilize sustainably, Open Interest (OI) needs to drop by at least 10%. This decline will make Bitcoin less vulnerable to short positions.
Without such a correction, while Bitcoin could sustain above $64,000 in the short term, breaking above $65,000 in the near term remains a major challenge.


