Like most cryptocurrencies, Bitcoin [BTC], the leading currency, has also shifted to an upward trend over the past 24 hours. Therefore, let’s evaluate some key metrics of BTC to determine whether it is still an opportune time for investors to purchase BTC.
Should you buy Bitcoin?
IntoTheBlock, a provider of analytics and metrics, recently posted a tweet highlighting an important metric. The tweet discussed BTC’s MVRV ratio, indicating that whenever this metric drops below 1, it presents an opportunity for investors to accumulate. Similarly, when the MVRV ratio exceeds 3, it’s a prime time for investors to sell. At the time of reporting, BTC’s MVRV ratio stood at 1.93.

This suggests that Bitcoin investors should be prepared as a buying opportunity may soon arise. Root, a renowned crypto analyst, tweeted about another crucial BTC metric. The tweet employed BTC’s on-chain value map, pointing out that BTC is fairly valued. Therefore, this also suggests that investors might consider accumulating.
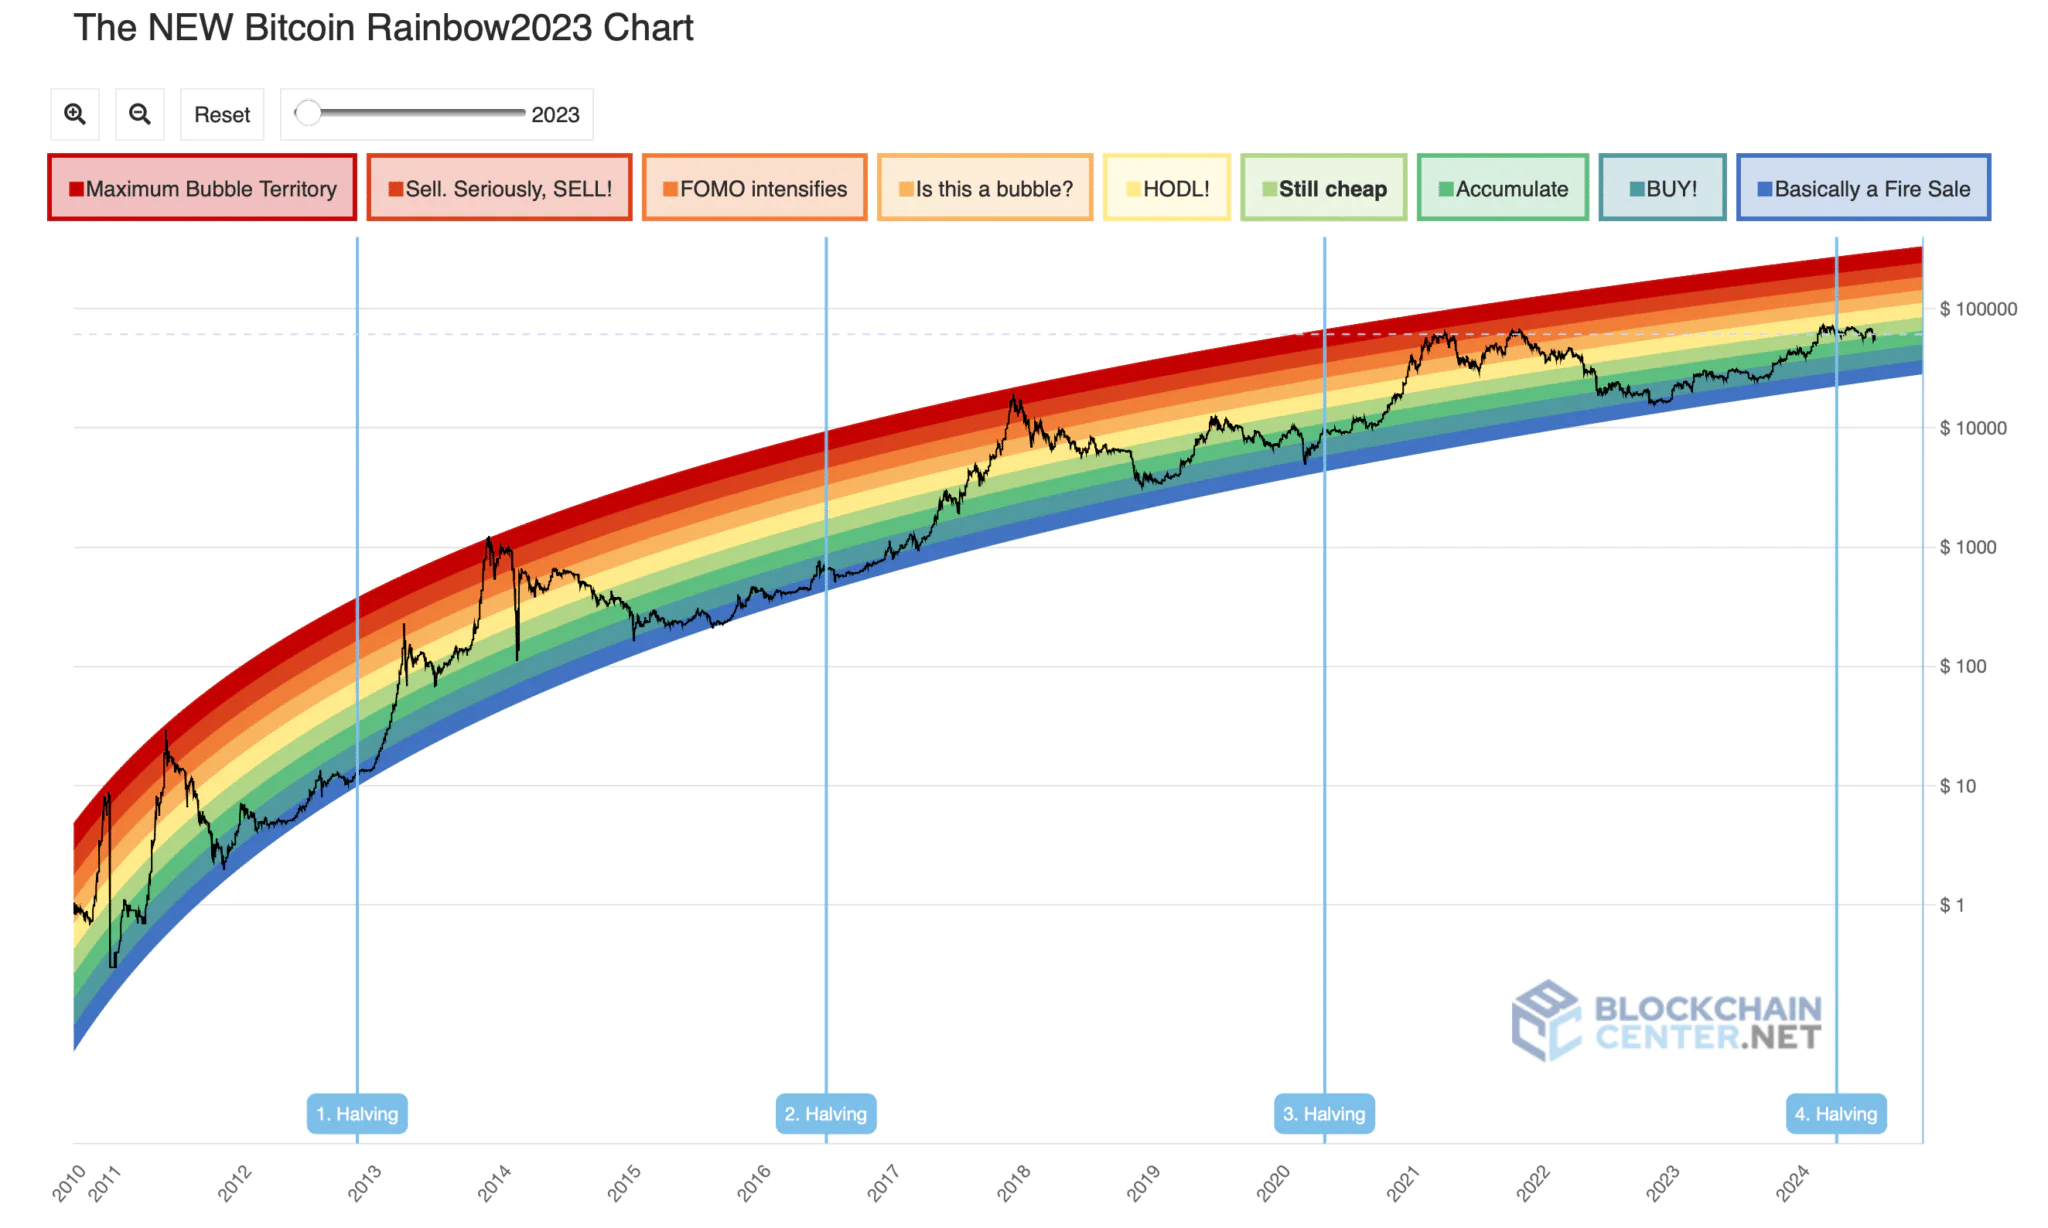
Subsequently, we examined the Bitcoin Rainbow Chart to see what insights it might offer. Our analysis indicates that BTC’s price is currently in the “accumulation” phase, signaling that this is an opportune time to stock up.

A Glimpse into Investor Actions
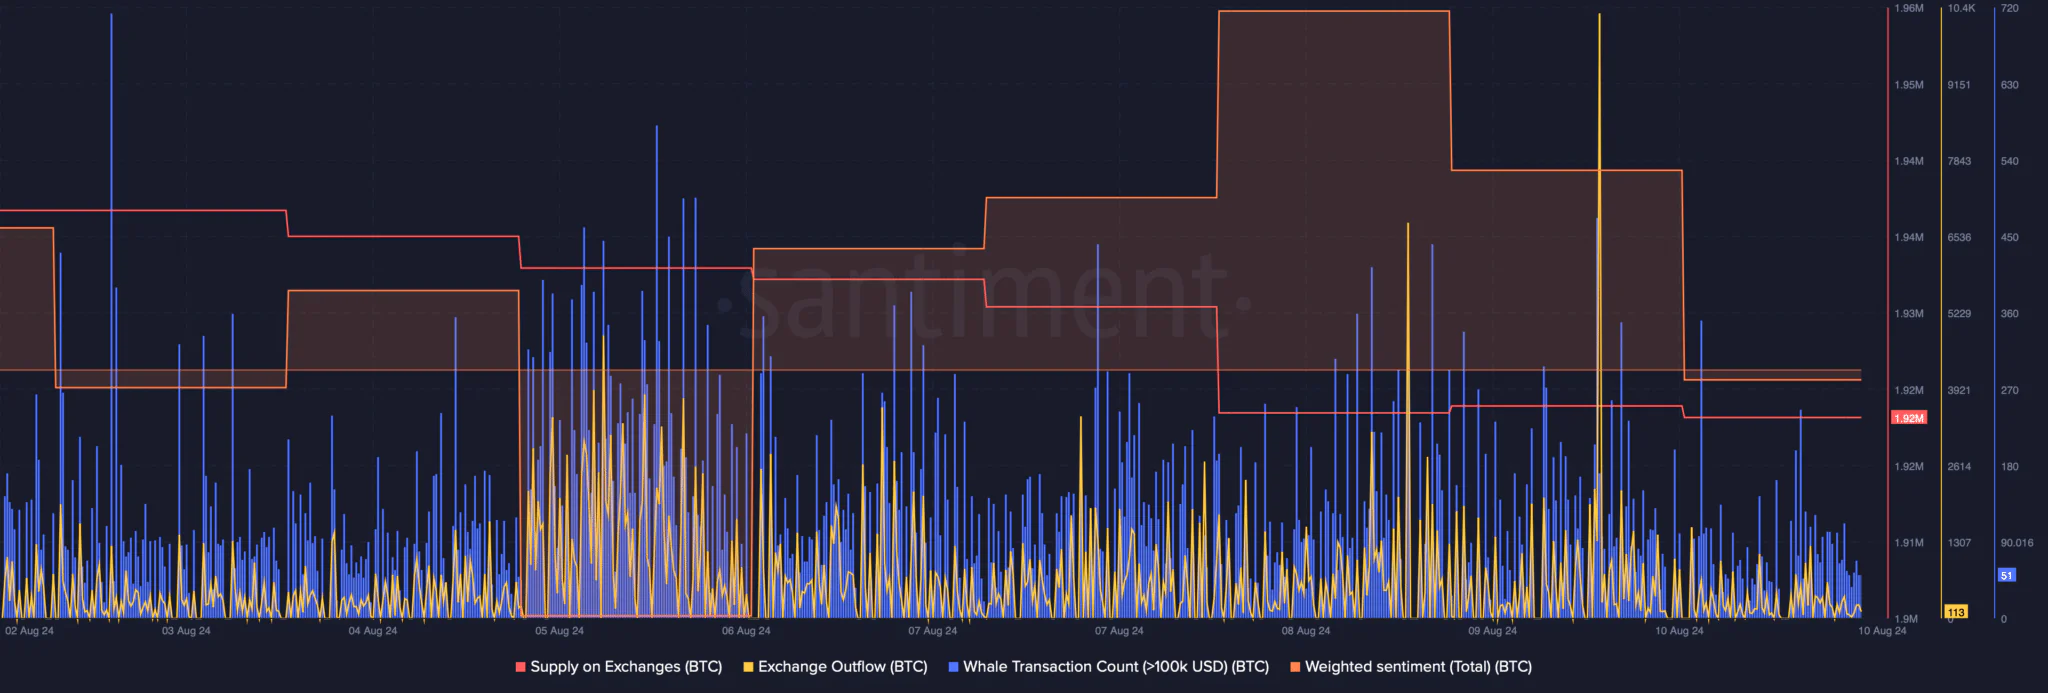
We then looked into BTC’s on-chain data to ascertain if investors have begun accumulating. Our analysis of Santiment’s charts reveals a decrease in Bitcoin supply on exchanges, signifying increased buying pressure.
The fact that investors are hoarding BTC was further evidenced by a significant increase in outflows from exchanges on August 9th. Additionally, major players are also actively acquiring BTC, as indicated by a rise in whale transaction volumes.

However, despite investors purchasing BTC, its weighted sentiment has declined and turned negative, indicating an increase in pessimism surrounding the currency. We then planned to review BTC’s daily chart to determine if this dip in weighted sentiment might lead to a price decrease in the coming days. Our analysis shows that BTC’s Chaikin Money Flow (CMF) has experienced a significant drop, suggesting a bearish takeover.
At the time of reporting, BTC is testing the 20-day Simple Moving Average (SMA), as indicated by the Bollinger Bands. Notably, the MACD suggests a potential bullish crossover, which could enable BTC to successfully surpass the 20-day SMA.


