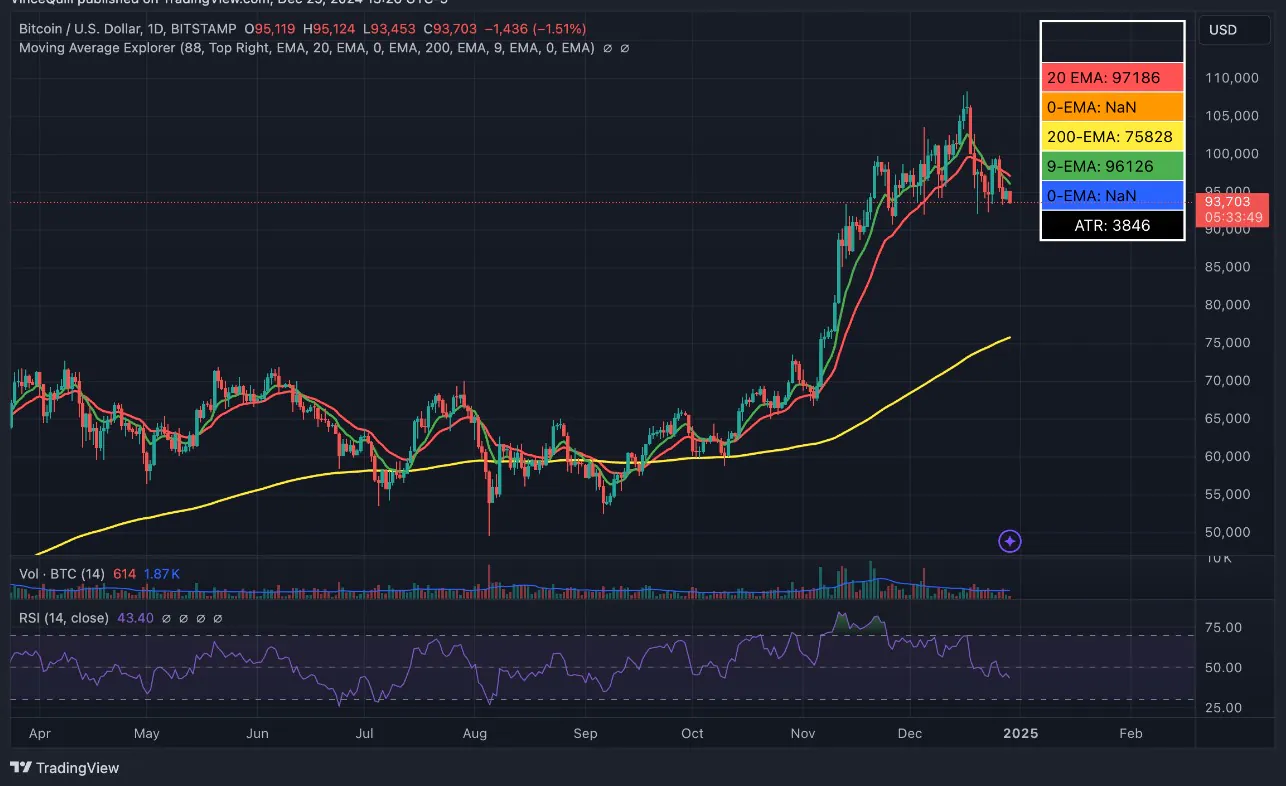
Bitcoin has fallen to $93,000, hitting an all-time low on December 20.
On the daily chart, Bitcoin is currently trading significantly below the 20-day EMA and is approaching the 50-day EMA. After a record-breaking rally in November and December, BTC has stabilized between $92,000 and $99,000.
However, Bitcoin has held above the 200-day EMA, a key support level since October 2024. The relative strength index (RSI) is currently at 42, indicating that the market is neither overbought nor oversold.

The Bitcoin buy-sell ratio, a market sentiment indicator, is currently at 0.92. When the index is below 1, it implies that sellers are in control.
TradingView analyst “The ForexX Mindset” recently warned of a potential major sell-off that could push Bitcoin to around $81,500, driven by the growth of USDT.
The increase in USDT positions is a sign that investors are seeking safety and moving away from risky assets.
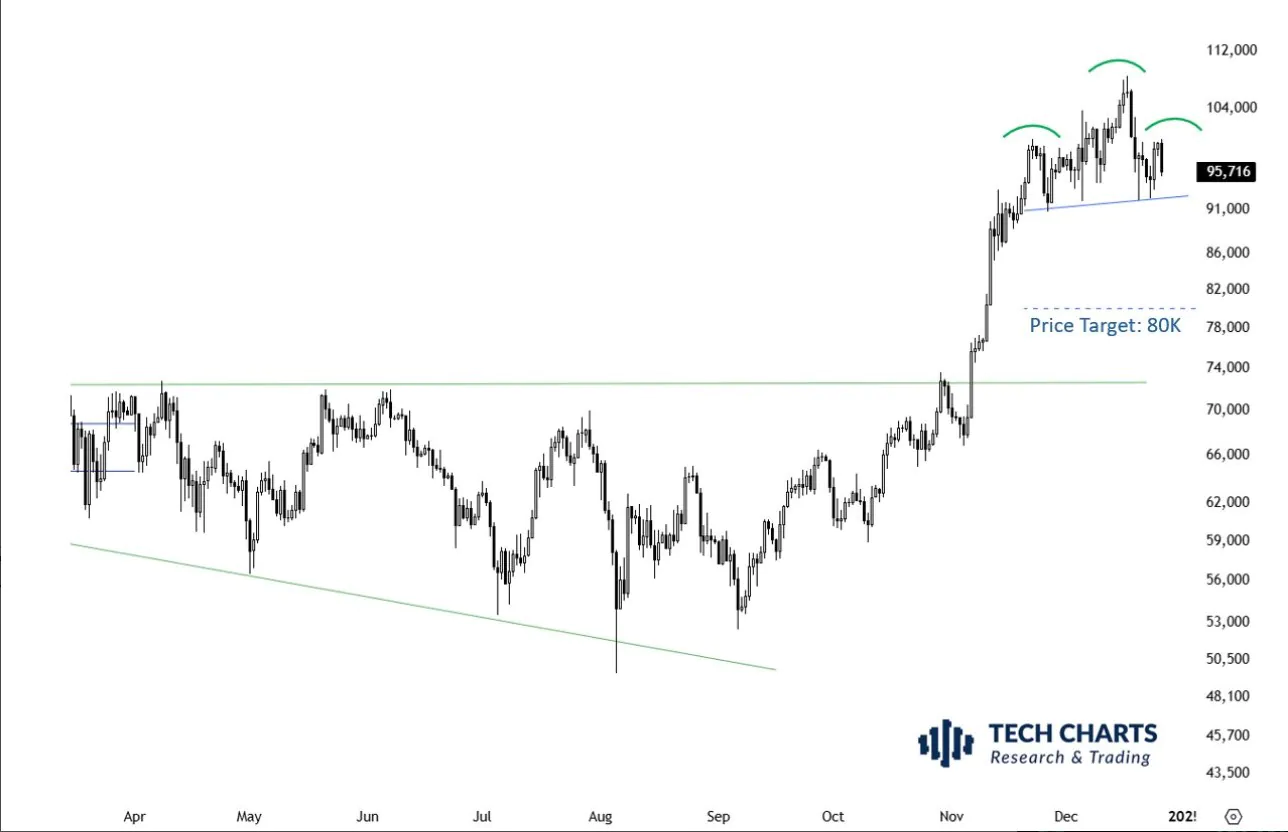
Technical analyst Aksel Kibar also predicted a correction to around $80,000 for Bitcoin. He noted that the classic head and shoulders chart pattern is signaling a potential decline in the coming weeks.
Despite the bearish signals and bearish sentiment from some traders, the funding rate for BTC perpetual futures remains positive. This suggests that long traders are dominant and are willing to pay short traders a premium to maintain open positions.

The long-term price of Bitcoin in the current cycle largely depends on the incoming Trump administration’s regulatory policies and the Federal Reserve’s monetary direction in 2025.
Uncertainty around these macro factors has created a variety of predictions about Bitcoin’s price target. Cryptocurrency mining company Blockware recently predicted that the price of BTC in 2025 could range between $150,000 and $400,000.


