Bitcoin (BTC) Price Analytics: Be careful when trading BTCUSD

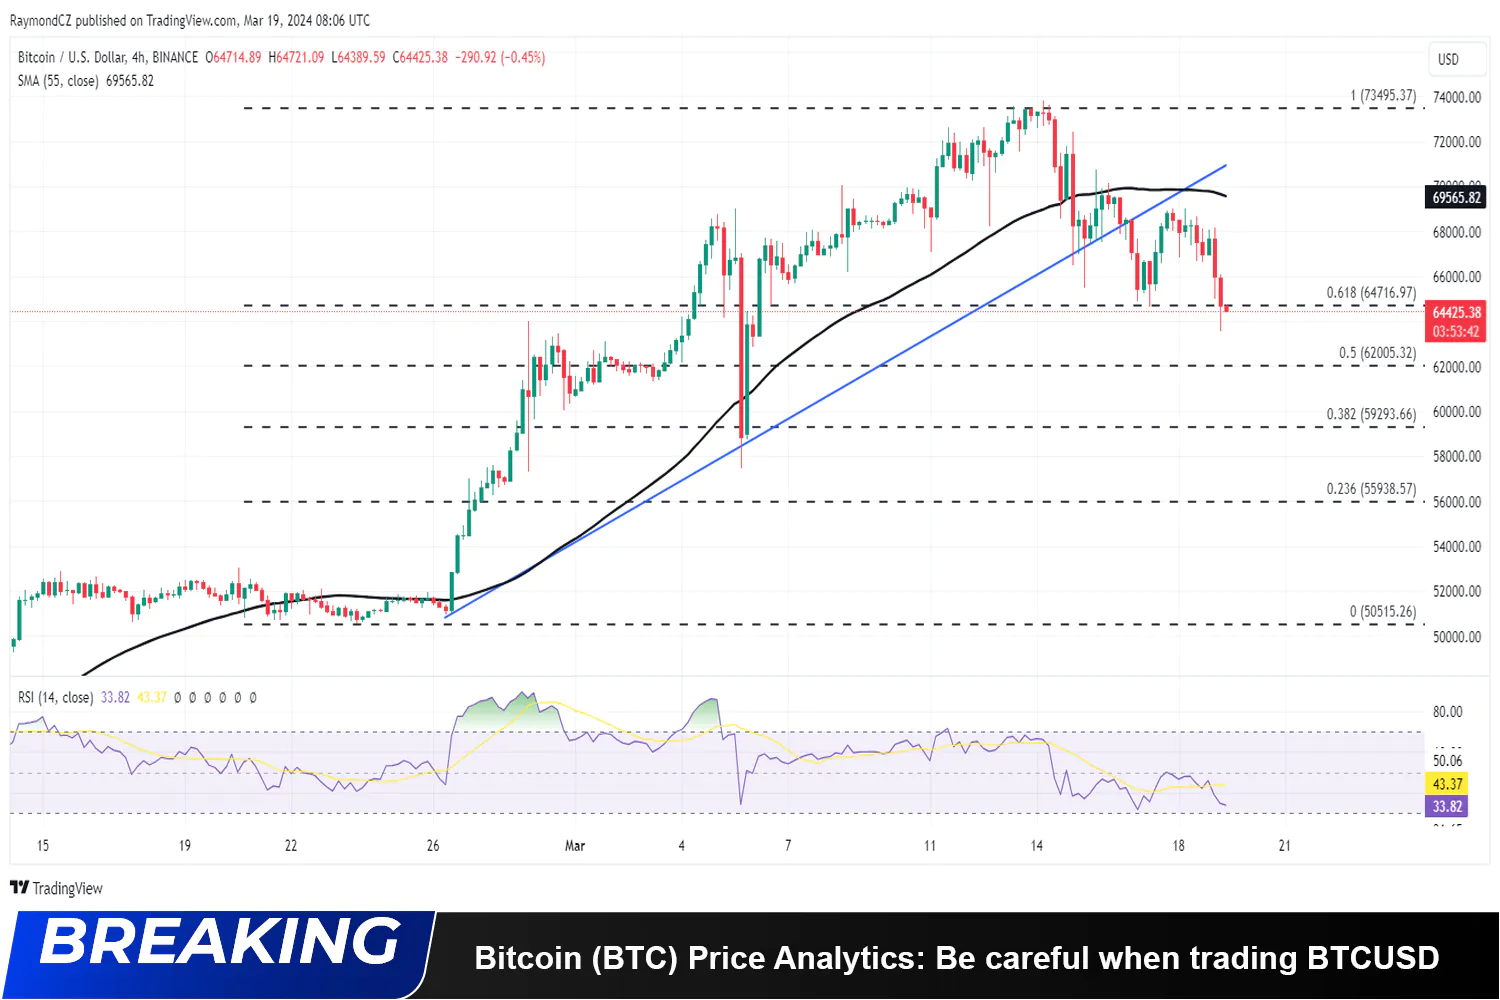
Bitcoin price is currently trading below $65000 and the 55 simple moving average (4-hours). In general, the price may continue to decrease to the $60,000 - $62,000 area.

Bitcoin Price
  • Bitcoin price fell from all-time high around 73500 against the US Dollar.
  • The price is currently trading below $64470 and the 55 simple moving average (4-hours).
  • There was a break below the key uptrend line followed by a retest of the $69,000 price range and continued decline on the 4-hour chart.
  • Bitcoin’s price is struggling and could fall to the $60,000 – $62,000 range

Bitcoin (BTC) Price Analysis

Over the past few weeks, the price of Bitcoin has risen steadily past all-time highs amid market-wide euphoria.

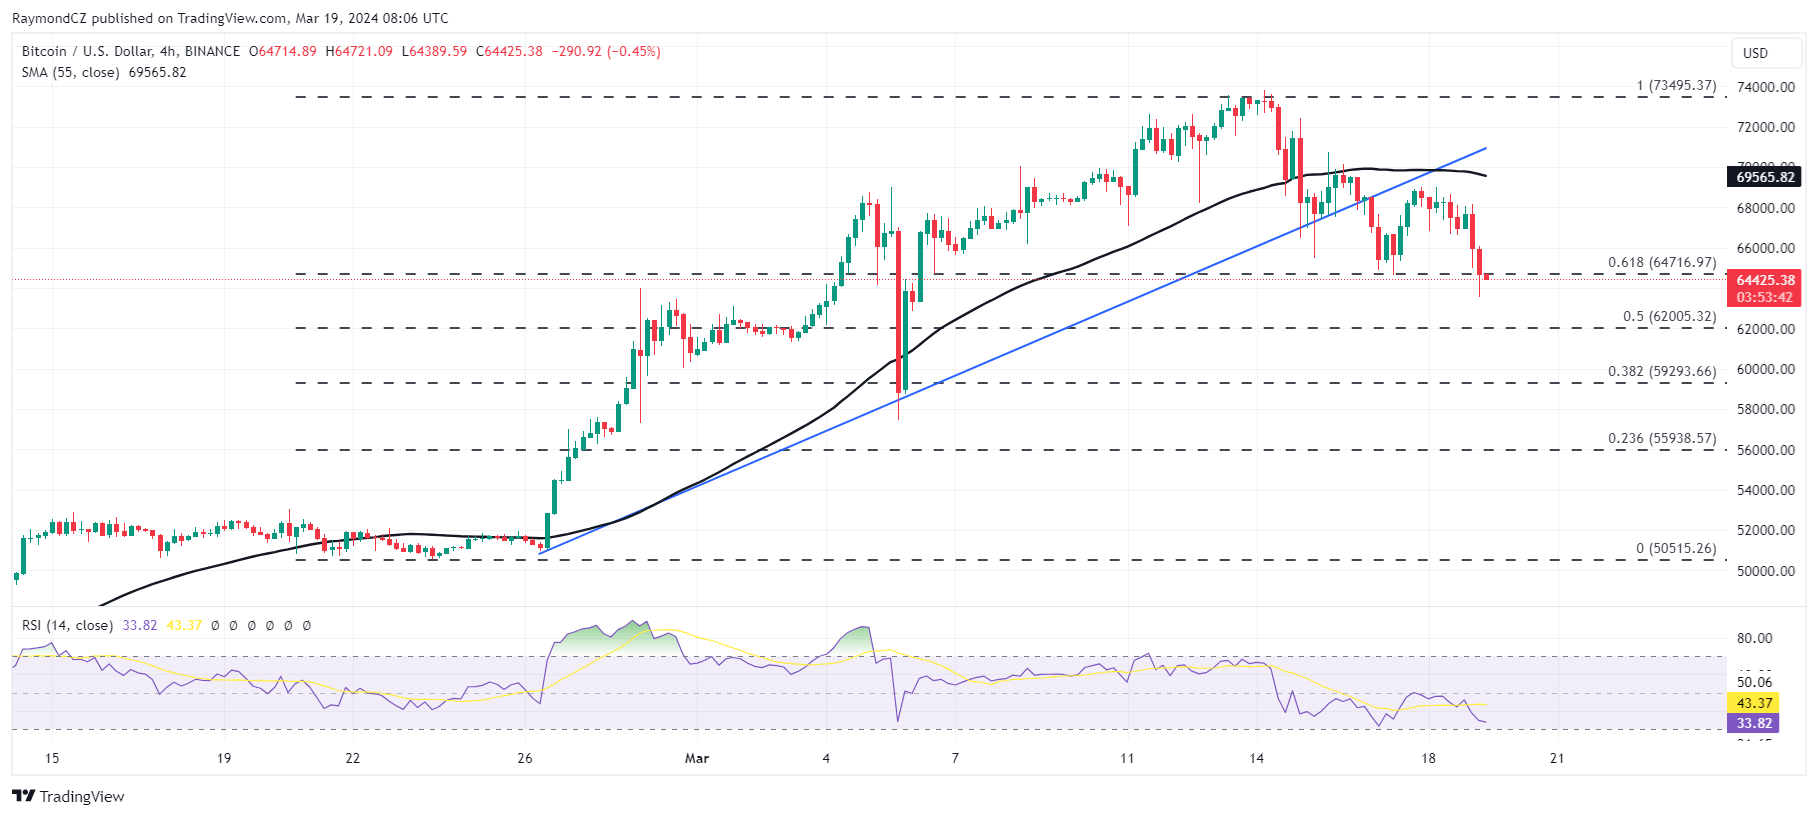
After reaching the peak, the price moved into the adjustment phase to MA55 and then broke through the MA55 line and continued to break through the previous uptrend line.

The market continues to face difficulties as the price unsuccessfully returns to test the $69,000 – $70,000 range and continues to decline.

Btcusd_2024 03 19_15 06 17

A clear bearish trend could take Bitcoin price decrease $60000 – $62000.

Looking at the chart, Bitcoin price is currently trading below $65000 and the 55 simple moving average (4-hours). In general, the price may continue to decrease to the $60,000 – $62,000 area.

Technical indicators

  • 4-hour MACD – The MACD for BTC/USD is currently accelerating in the bearish zone.
  • 4-hour RSI – The RSI for BTC/USD is currently below the 50 level.
  • Key support levels – $62000 and $59300.

5.0/5

(2 votes)
  1. Avatar of Musa Mohammed
    Musa Mohammed

    Azcnews

  2. Avatar of HALILU ISAH BABANGORO
    HALILU ISAH BABANGORO

    Bitcoin

  3. Avatar of Sam
    Sam

    Bitcoin is in a bearish trend

Leave a Reply

Your email address will not be published. Required fields are marked *

Latest

Azcnews Xrp

News | Altcoin | Analytics | Editor Choice

XRP Has Recovered But Trader Sentiment Remains Low

XRP has experienced a minor recovery, reclaiming the $0.5 USD price level; however, trader sentiment remains low.

Azcnews Breaking

News | Analytics | Bitcoin | Editor Choice

Bitcoin Halving Chart History Analysis

Let's explore the Bitcoin Halving Chart History - a visual representation illustrating halving events and their impact. From there, we can gain a better understanding of Bitcoin's supply cycle model.

Ada Price

Analytics

Cardano (ADA) Price Analysis: Risk of Downside Break Below $0.635

Cardano’s price started a steady increase above the $0.700 resistance zone against the US Dollar. The ADA/USD pair gained pace for a move above the $0.720 and $0.750 levels.

Ripple Price Analysis

Analytics

Ripple Price Analysis: Key Support Intact Above $0.55

Ripple price started a downside correction from the $0.640 zone against the US dollar. The price is now trading below $0.6250 and the 55 simple moving average (4 hours). There is a key bearish trend line forming with resistance at $0.6200 on the 4-hour chart of the XRP/USD pair (data source from Kraken). The pair

Stellar Lumen (xlm) Price

Analytics

Stellar Lumen (XLM) Price Could Gain Pace If It Clears $0.15

Stellar lumen price is attempting a fresh increase from the $0.1165 zone against the US Dollar. XLM price is now trading near $0.140 and the 55 simple moving average (4 hours). There is a key bullish trend line forming with support near $0.1355 on the 4-hour chart (data feed via Kraken). The pair could accelerate