- ADA price started a downside correction from the $0.650 zone against the US Dollar.
- The price is now trading above $0.50 and the 55 simple moving average (4 hours).
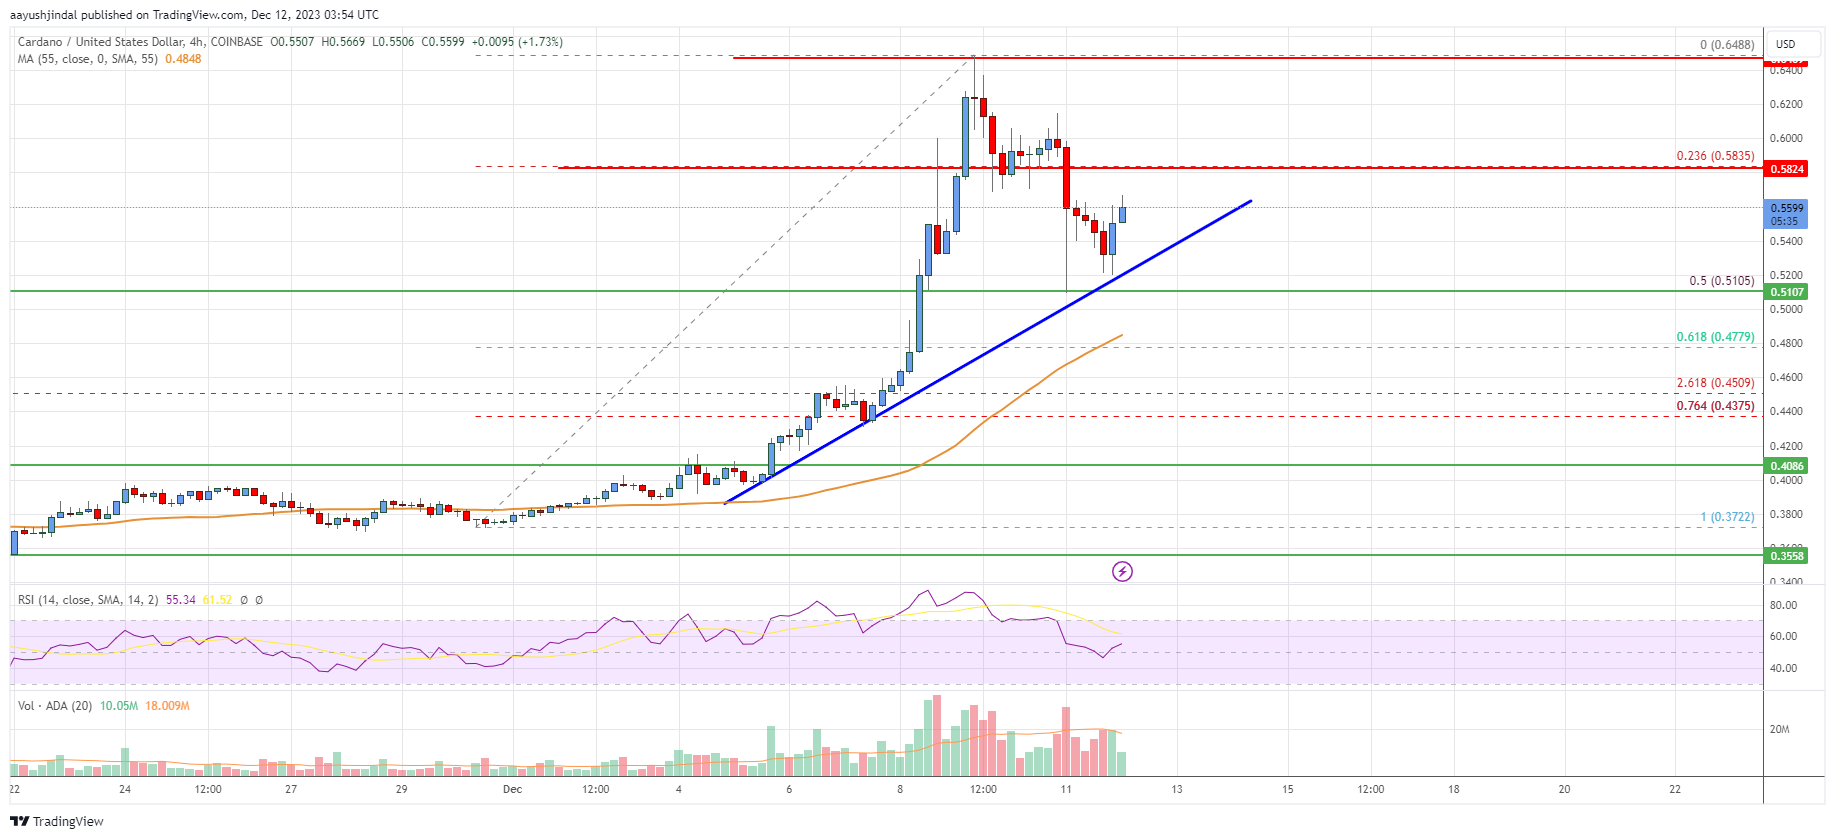
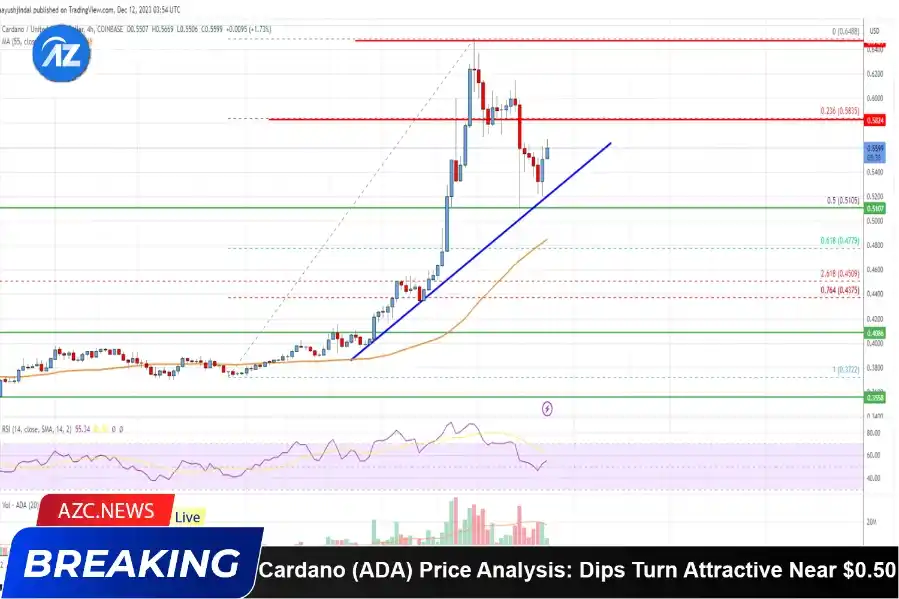
- There is a connecting bullish trend line forming with support near $0.540 on the 4-hour chart (data feed via Coinbase).
- The price could start a fresh increase if it clears the $0.584 and $0.600 resistance levels.
Cardano’s price is consolidating above $0.500 against the US Dollar, like Bitcoin. ADA price could resume its rally if there is a clear move above the $0.584 resistance.
Cardano Price (ADA) Analysis
In the past few weeks, Cardano’s price started a steady increase above the $0.500 resistance zone against the US Dollar. The ADA/USD pair gained pace for a move above the $0.555 and $0.585 levels.
The price tested the $0.650 zone. The bulls a few attempts to clear the $0.650 hurdle, but they failed. The recent high was formed near $0.6488 and the price is now correcting lower. There was a move below the $0.550 support zone.
The price dipped below the 23.6% Fib retracement level of the upward move from the $0.3722 swing low to the $0.6488 high. ADA price is still trading above $0.500 and the 55 simple moving average (4 hours).
Besides, there is a connecting bullish trend line forming with support near $0.540 on the 4-hour chart. On the upside, immediate resistance is near the $0.584 zone. The next major resistance is near the $0.600 zone. A clear move above the $0.600 resistance might start a strong increase toward $0.650.
Any more gains above the $0.650 resistance might send the price toward the $0.680 resistance or even $0.700. On the downside, immediate support is near the $0.540 level or the trend line.
The next major support is near the $0.510 level or the 50% Fib retracement level of the upward move from the $0.3722 swing low to the $0.6488 high. A clear move below the $0.510 level might send the price toward the $0.500 level. Any more losses might send the price toward the $0.465 support.

The chart indicates that ADA price is now trading above $0.500 and the 55 simple moving average (4 hours). Overall, the price could gain bullish momentum if it clears the $0.584 and $0.600 resistance levels.
Related: NFTs on Cardano Experience Decline Following Last Month’s Dominance
Technical Indicators
4 hours MACD – The MACD for ADA/USD is now gaining pace in the bullish zone.
4 hours RSI – The RSI for ADA/USD is now above the 50 level.
Key Support Levels – $0.540 and $0.510.
Key Resistance Levels – $0.584 and $0.600.
 OMN
OMN  BTC
BTC  ETH
ETH  USDT
USDT  XRP
XRP  BNB
BNB  SOL
SOL  USDC
USDC  TRX
TRX  DOGE
DOGE 


