As Ethereum (ETH) retraces its earlier December gains, the market is witnessing potential increased selling pressure, as indicated by key metrics. Despite the bullish trend and market structure prevailing on the one-day chart, on-chain indicators suggest a growing influence of selling forces.
The deflationary nature of Ethereum remains a source of confidence for long-term holders. However, estimates of a shrinking ETH supply present challenges to short-term market sentiment, leaving the possibility of a move to $2000 or lower.
Can the $2130 Support Level Endure?
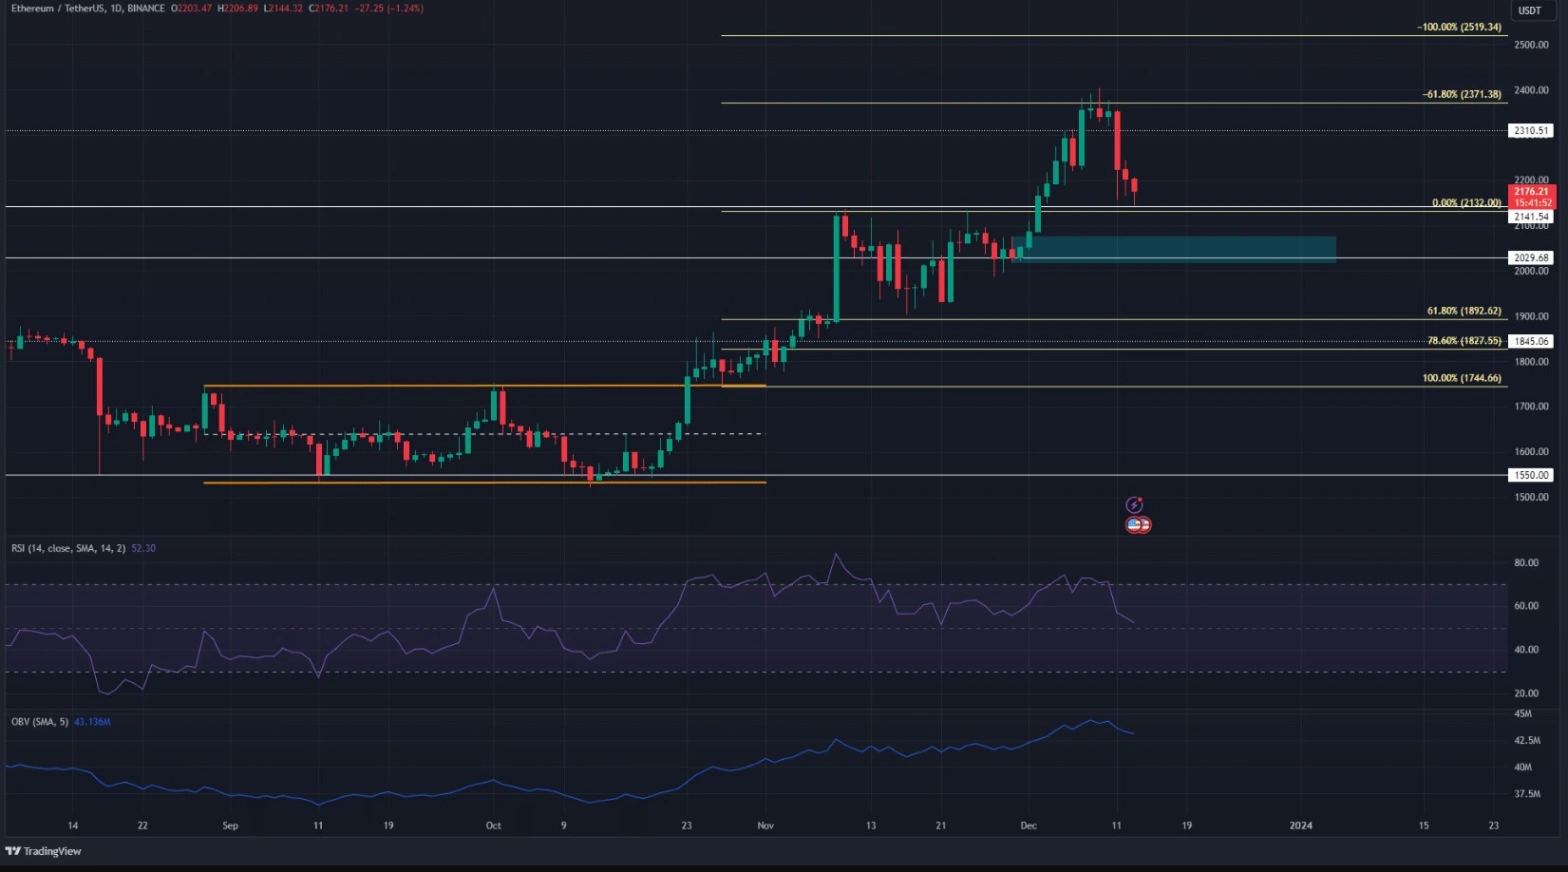
A critical question arises: will the $2130 support endure? In early November, ETH surged to $2130, followed by a three-week retracement period before the bulls regained control. Successfully securing the $2000 level as support, Ethereum surpassed local highs at $2130.
During the ascent, ETH consolidated at the $2030 region before experiencing a rapid push northward, highlighted in cyan. This area, in close proximity to the $2000 mark, is identified as a robust support zone.
The recent higher low at $2019 holds significance, with a breach potentially flipping the one-day market structure bearishly. As of now, the RSI hovers just above the neutral 50, indicating bullish momentum.
In this intricate scenario, Ethereum’s price movements prompt careful consideration of the potential challenges posed by increased selling pressures and the critical support levels ahead.”
Cautionary Signals from Key Metrics
Cautionary Signals in Ethereum Metrics: OBV Uptrend Interrupted, Age-Consumed Spikes, and Increased Selling Pressure
While the On-Balance Volume (OBV) displayed an overall uptrend, recent days witnessed a dip, raising cautionary flags.
Related: Ethereum’s Dramatic Supply Reduction: A Game-Changing Shift for ETH Investors
Several metrics contribute to this sense of caution:
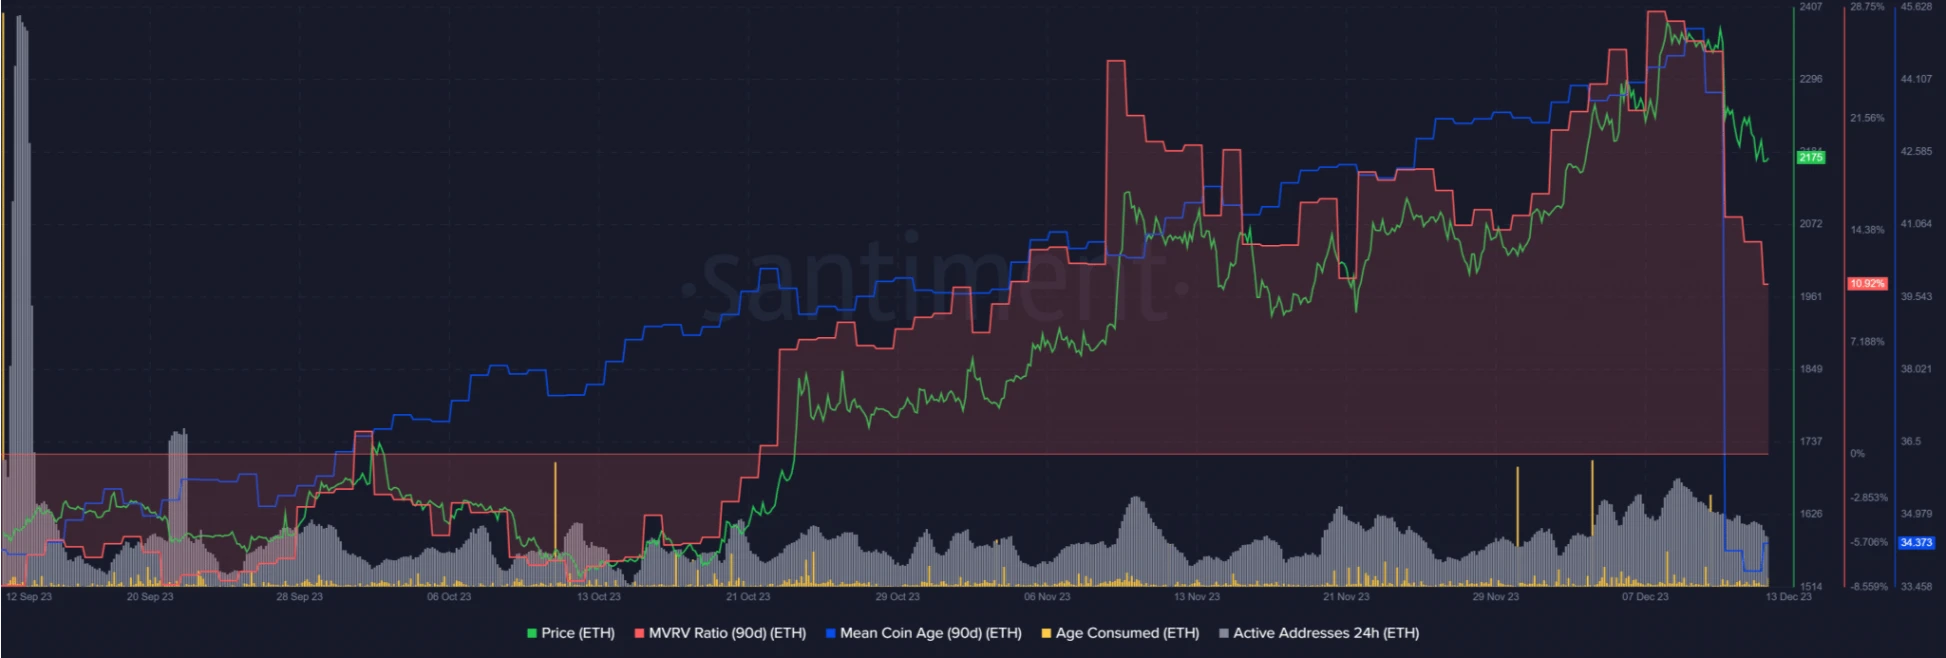
1. Age-Consumed Metric: Notable spikes over the past two weeks, particularly on December 10th at $2340, signaled heightened activity and a potential increase in selling pressure.
2. Mean Coin Age: Following a robust uptrend, the mean coin age experienced a sudden decline a few days later. This suggests a substantial movement of ETH between addresses, indicating a spike in selling pressure.
3. Price Movement: The intensified selling pressure resulted in a decline in Ethereum prices, approaching the $2100 mark.
4. Active Addresses Count: Notably, the count of active addresses began to falter over the past week, indicating a decrease in overall network activity.
5. MVRV Ratio: Reaching a new high, the MVRV ratio signaled profit-taking, as holders with profitable ETH positions chose to sell their assets.
Overall, these metrics collectively suggest reasons for concern among long-term investors, highlighting the need for a cautious approach in response to the evolving dynamics within the Ethereum market.”
Top of Form


