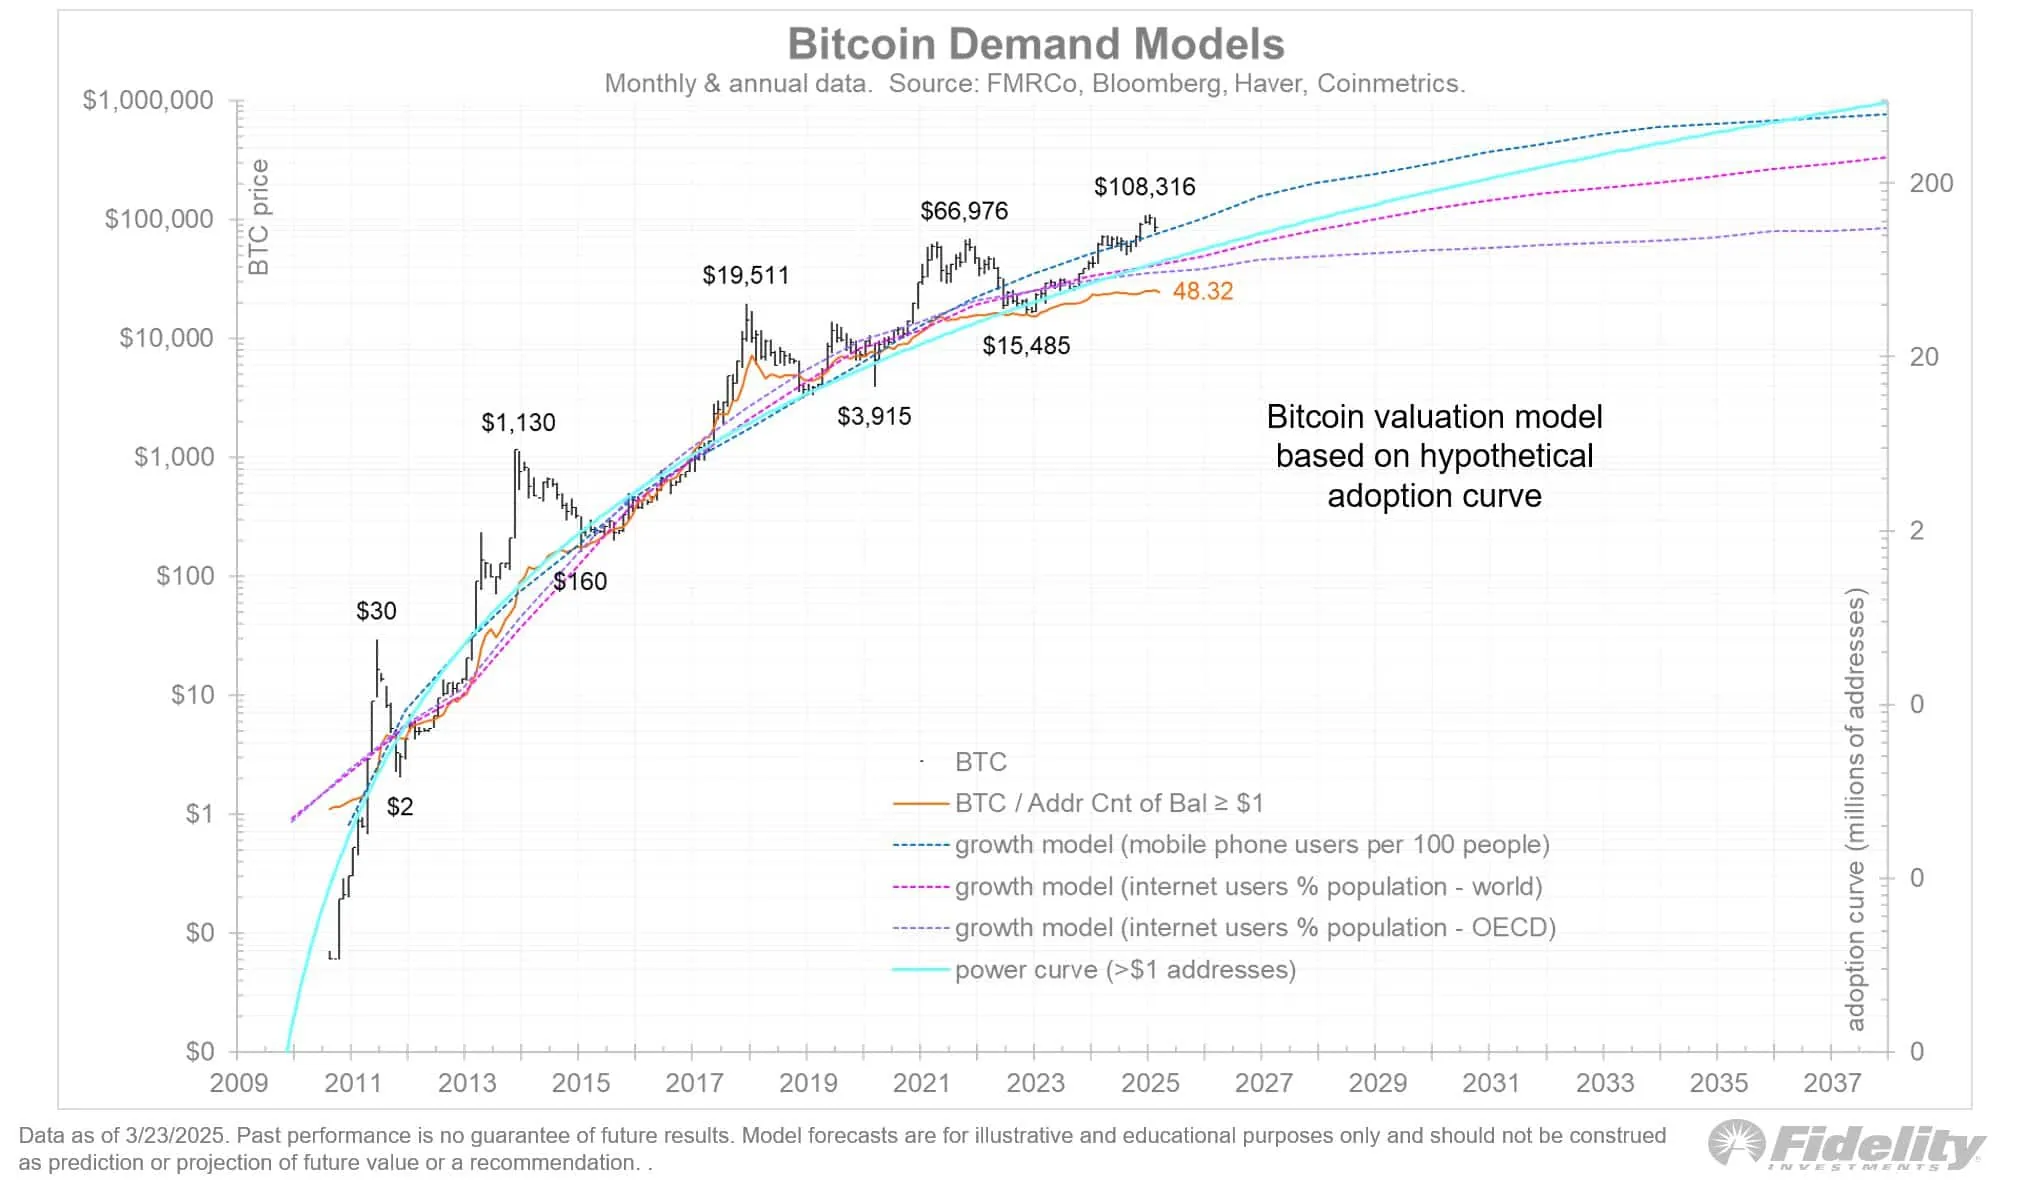
The chart indicates that since Bitcoin’s [BTC] bull run after 2020, the growth rate of unique wallets and active addresses has shown signs of slowing down — particularly for wallets with a balance exceeding 1 USD.
This stagnation reflects the adoption curve model, suggesting that BTC accumulation has increasingly concentrated in a small number of high-value wallets. Large-scale entities, such as MicroStrategy (MSTR), have amassed substantial Bitcoin holdings, reducing broad distribution among retail investors.
Ethereum [ETH] exhibits a similar trend, with the lowest adoption rate recorded in 2025. As institutional dominance grows, on-chain metrics have become less reliable in assessing retail investor participation.

This structural shift could have a significant impact on the market. Institutional wallets are now playing a crucial role in liquidity cycles. A clear example is Bitcoin’s sharp decline to 77,000 USD in February, coinciding with continuous outflows from BTC ETFs.
On February 25, Bitcoin ETFs recorded net outflows of up to 1.4 billion USD, causing a 5.11% price drop within just 24 hours. Similarly, Ethereum ETFs are still experiencing prolonged sell-offs and face challenges in attracting new capital.
Notably, these institutional outflows coincided with the Trump administration’s stringent tariff policies, adding another layer of macroeconomic volatility to the cryptocurrency market.


