XRP’s Unprecedented Move Sparks Speculation: A Closer Look at Its Implications
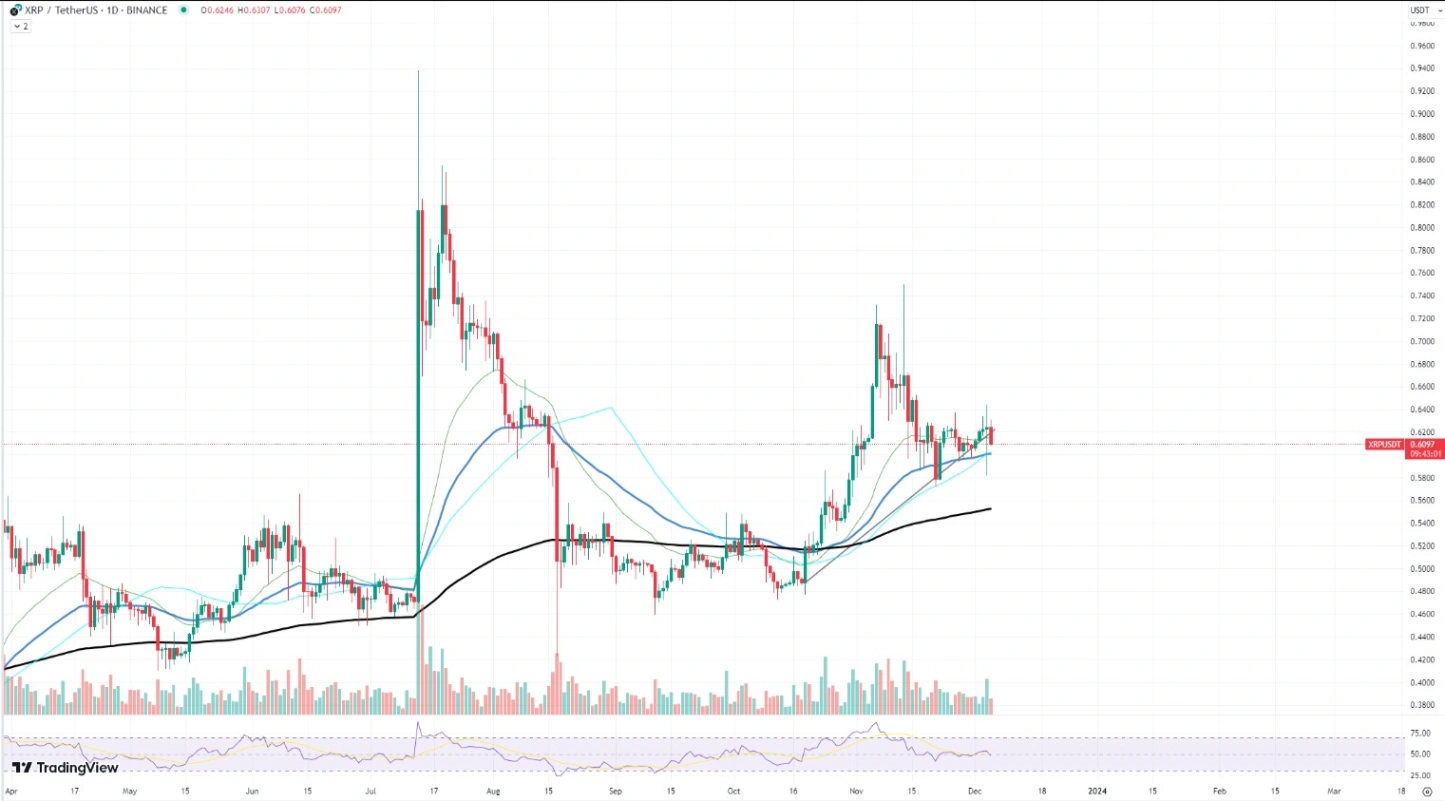
In a recent development, XRP exhibited a noteworthy shift that has intrigued even seasoned market observers. The chart revealed a candle with substantial wicks extending in both directions, an unusual occurrence signaling intense volatility within a brief timeframe. This type of price action typically raises concerns about potential market manipulation, with significant players seeking to influence the market for their advantage.
This peculiar activity disrupted the otherwise lackluster market performance, creating a visual anomaly on the charts. Events like these can trigger a domino effect of stop-loss orders from various traders, potentially resulting in a cascade of buy and sell orders that magnify the currency’s volatility. The incident with XRP appears to be a substantial liquidity hunt, where large orders target pockets of liquidity found at traders’ stop-loss levels before the price returns to its typical trading range.
In recent times, XRP has displayed a mixed performance, characterized by sideways trading with no clear directional trend. The presence of such market anomalies, particularly those hinting at potential market manipulation, often serves as an early indicator of an impending significant price correction.
Investors and traders may interpret these movements as a warning to exercise caution, signaling an unstable market environment that could potentially shift to a bearish trend.
Solana’s Upward Momentum Comes to a Halt
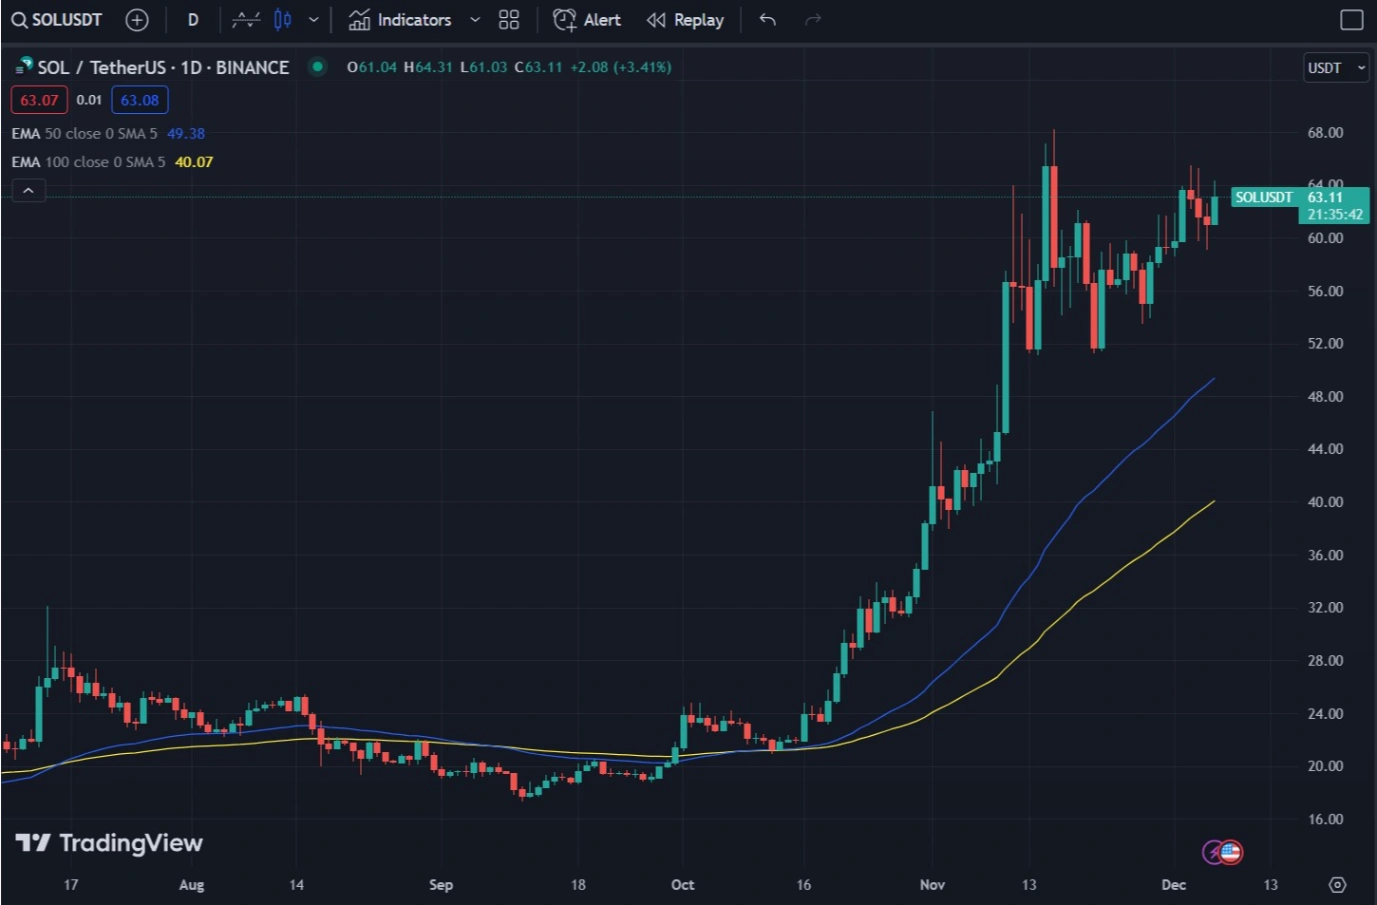
Solana (SOL), on the other hand, has been on an impressive upward trajectory, capturing the attention of investors and traders with its robust price performance. Currently stabilizing around the $60 mark, Solana is undergoing a consolidation phase—a period where market participants assess the asset’s future potential and solidify their positions in anticipation of the next significant move.
Examining the provided chart underscores Solana’s strong performance, with its price comfortably positioned above crucial moving averages. This consistent performance suggests that the digital asset is gearing up for a substantial breakthrough. A closer analysis of the chart indicates the formation of a consistent series of higher lows, signaling growing confidence among buyers and potentially paving the way for a sustained bull run.
If Solana manages to breach its current consolidation zone, the probability of a continued price breakthrough remains high. The cryptocurrency’s resilience and steady ascent not only indicate the potential to maintain its current level but also suggest an upward trajectory toward more ambitious price targets. Investors and traders are closely watching as Solana appears poised for further positive developments in the market.
Related: Bitcoin Hits $44K, Holds 8th Consecutive Green Candle on Weekly Chart
Investors are eagerly anticipating signs of a breakout that could propel Solana towards its previous all-time highs. The positive market sentiment surrounding Solana is driven by its robust ecosystem and the increasing adoption of its blockchain for diverse applications, including decentralized finance (DeFi) and non-fungible tokens (NFTs). This solid foundation, coupled with favorable technical indicators, suggests that Solana is making a clear upward rally, cutting through the market noise.
Bitcoin’s Performance
On the other hand, Bitcoin’s performance has been nothing short of cosmic, exceeding all expectations. The leading cryptocurrency has displayed a robust bullish trend, breaking through resistance levels with a confident push that has prompted many market observers to reconsider their forecasts. The chart illustrates a distinct price rally, with Bitcoin consistently forming higher highs and higher lows.
The current price level holds particular significance, acting as both a psychological and technical barrier in the past. A breakthrough at this level could confirm sustained bullish momentum, potentially establishing new support zones that serve as launchpads for further gains.
However, the price action reveals extended wicks on the upper side of recent candles, indicating rejection at higher levels and hinting at a potential reversal. Additionally, the trading volume has been inconsistent, with significant spikes on upswings but not consistently supporting the rally. This divergence between price and volume often signals an impending price reversal. Market participants are also cautiously monitoring macroeconomic indicators and regulatory news that could impact market sentiment and influence Bitcoin’s trajectory.


