XRP’s Long Consolidation vs. ETH’s Cooling Momentum
According to market strategist CrediBULL Crypto, XRP’s price trajectory has been a true test of patience. For nine consecutive months, XRP has held above its highest-ever monthly close, largely moving sideways after earlier rallies. Historically, such extended consolidation patterns were observed in both Bitcoin (BTC) and XRP itself, often preceding explosive breakouts.
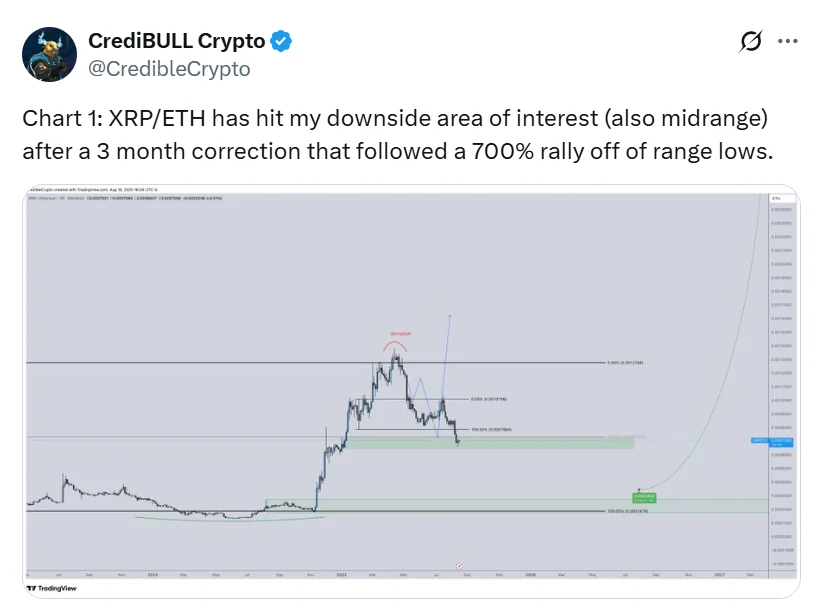
Notably, the XRP/ETH trading pair has pulled back to a crucial support zone following a 700% surge earlier this year and a three-month correction. This level, often referred to as a mid-range area, has historically acted as a springboard for renewed momentum.

Meanwhile, Ethereum is approaching a new all-time high after completing a clear five-wave pattern that started near $2,100. Technical analysts note that such formations typically signal a cooling-off phase as the market digests profits — suggesting ETH’s rapid ascent may soon slow.
CrediBULL emphasized:
“Taken together, the data suggests that XRP is getting closer to a phase of outperformance against ETH.”
Price Action: Strong but Risks Remain
At press time, XRP was trading at $3.01, up 0.1% over the past 24 hours but down 4.6% over the week. Data from CoinGecko shows the token has fluctuated between $2.95 and $3.10 in the past day, and between $2.96 and $3.34 over the week. Despite the pullback, XRP remains more than 430% higher year-on-year, underscoring its resilience in the current cycle.
Analyst Ali Martinez has previously identified $2.80 as a make-or-break level for XRP. This zone, where large investors accumulated over 1.7 million tokens worth $5 billion, has proven critical. Earlier this month, XRP tested this support before rebounding toward the $3.30 resistance. Market watchers now suggest that a decisive break above $3.26 could pave the way for XRP to challenge its recent peak near $3.65.
However, risks remain. A breakdown below $2.80 could send XRP tumbling toward $2.10. On the brighter side, in the XRP/BTC pair, the token has broken out of a multi-month downtrend, moving above both the 100-day and 200-day moving averages — a sign of relative strength against Bitcoin.


