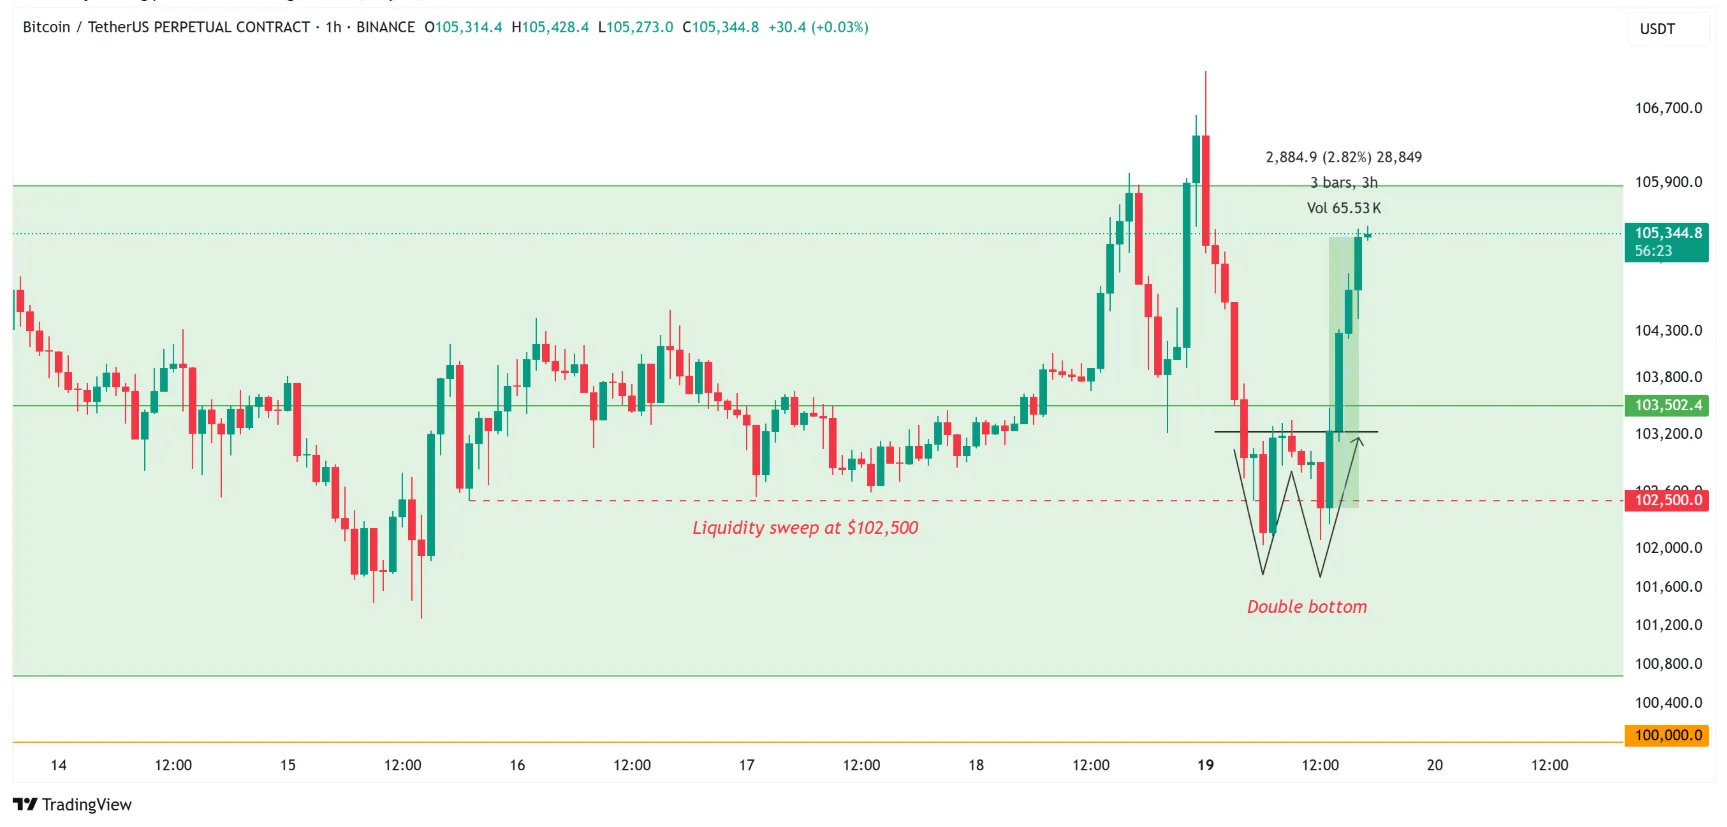
Latest on-chain data reveals a surge in Bitcoin buying momentum, supporting the continued upward trajectory of BTC as it keeps setting new price records. During the U.S. trading session, Bitcoin rebounded and broke past the $105,000 mark after forming a double-bottom pattern on the 1-hour chart.
Liquidity around the $102,500 level has been absorbed — a signal that could pave the way for the next leg up in the market this week.
Fractal Pattern Suggests Potential for New All-Time High

Currently, Bitcoin is fluctuating between $100,600 and $106,300 — a price range that mirrors a previous consolidation phase from $92,700 to $97,900. This fractal structure displays three key characteristics:
- Rapid reversals after hitting highs and lows within the range.
- The formation of a double-bottom pattern shortly after topping out at $97,900 and $107,144.
- Double-bottoms forming near the bottom of the range, sweeping internal liquidity and establishing strong support zones.
In the next 24 hours, BTC is likely to consolidate within the $103,500 to $105,200 zone (highlighted in orange), similar to the sideways movement seen between $95,800 and $97,300 in the past. If the fractal pattern holds, Bitcoin could break above $107,000 and surge toward a new all-time high above $110,000 later this week.
However, if BTC fails to hold the $103,500 level, the market may see a pullback to the support area around $102,000. In that case, the fractal structure could break down, making a drop below $102,000 in the coming days more plausible.
Strong Accumulation from Retail Investors to Whales

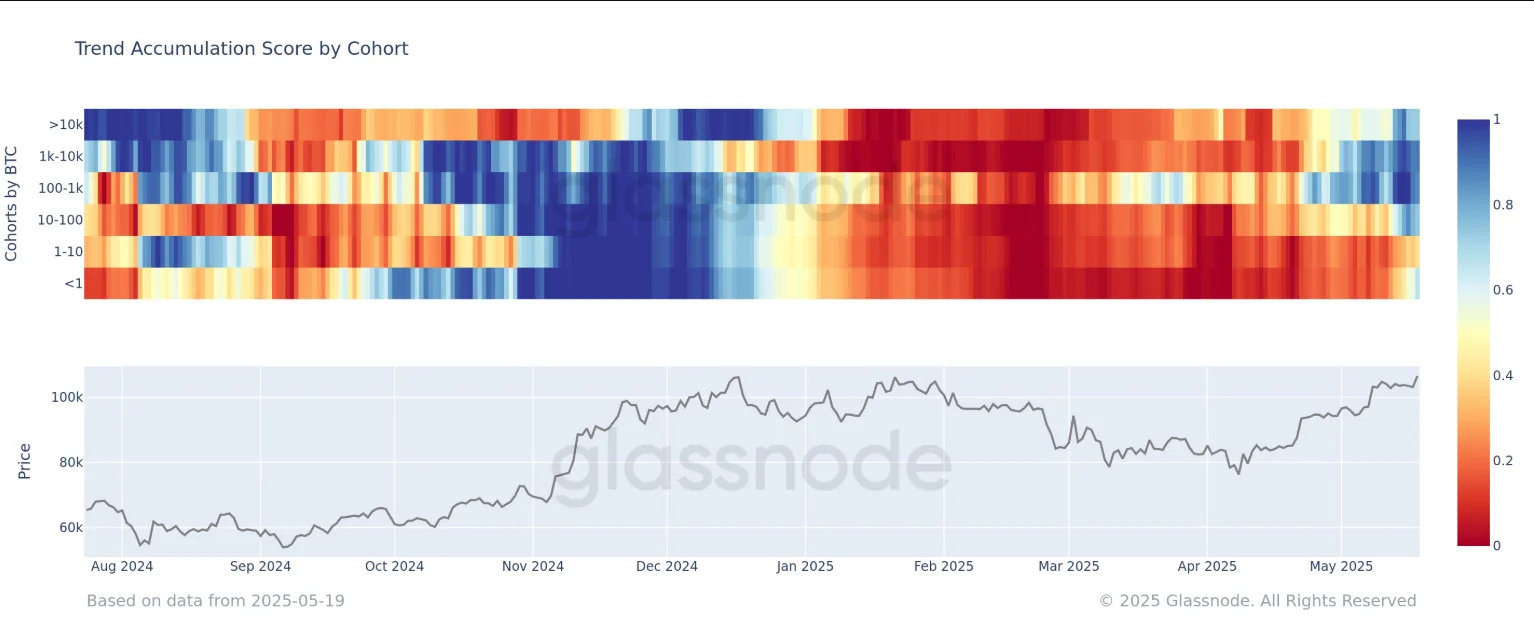
According to Glassnode data, investor behavior across the Bitcoin network is undergoing a notable shift. The “Accumulation Trend Score” chart indicates that small holders — those owning less than 1 BTC — are actively buying, with the score reaching 0.55.
More notably, larger cohorts such as those holding 100–1,000 BTC and 1,000–10,000 BTC are also showing strong accumulation patterns, with scores of 0.9 and 0.85, respectively. Only the 1–10 BTC group remains in a distribution phase.
The heatmap is gradually shifting from blue to red — a transition from distribution to accumulation — reflecting growing market confidence. Historically, such trends have often preceded major Bitcoin bull runs.
Bearish Divergence Raises Short-Term Concerns
Despite the bullish outlook, some technical indicators are flashing caution. Crypto analyst Bluntz recently pointed out a bearish divergence on the daily chart: while price continues to push new highs, the RSI is forming lower highs — a sign that buying strength may be fading despite rising prices.
This could serve as an early warning for a potential short-term correction, something traders should keep an eye on in this highly volatile environment.


