What is ATH?
ATH, short for “All Time High,” is not just a simple term but also an important concept in the financial markets. It refers to the highest price level that a cryptocurrency or any asset has ever reached from a past point in time to the present.
When an asset reaches ATH, it signifies not only a number on the price chart but also a manifestation of success, strength, and market interest. This is a moment when investors, traders, and stakeholders feel excited and expectant.
What does ATH mean?
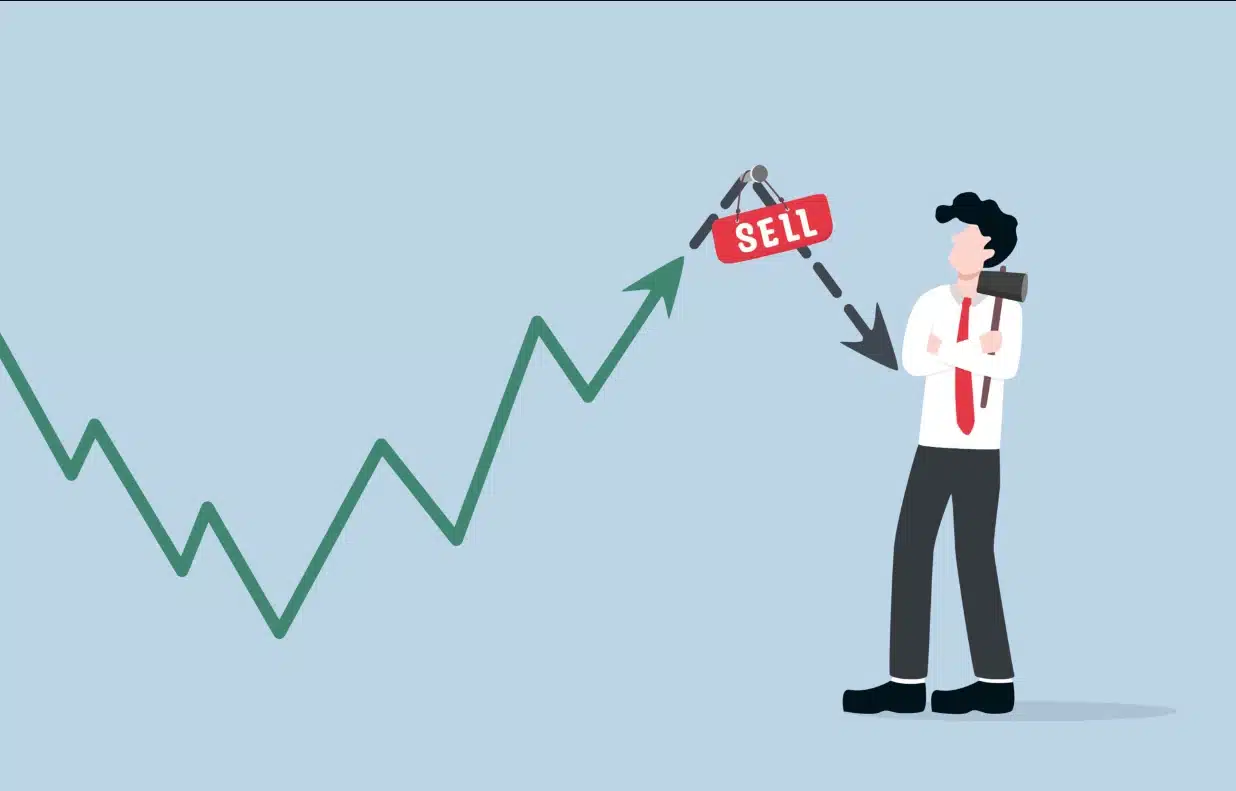
As we know, buying a cryptocurrency when it’s at its lowest price and selling when it reaches its peak is a way to make significant profits. However, when a cryptocurrency reaches its highest point, known as ATH (All Time High), the situation changes. Buying at this point and then selling can lead to significant losses for investors.
When a cryptocurrency reaches ATH, it usually means that its price has set a new record in trading history. During this time, there’s typically no over-supply or strong selling pressure from the bearish side. Instead, the bullish side (those who believe the price will rise) often creates strong upward pressure.
Depending on this situation, savvy investors can seize the opportunity to make substantial profits. However, when ATH appears, traders tend to rely more on intuition rather than careful technical analysis. This can lead to irrational decision-making and reckless trading actions.
What should investors do when ATH appears?
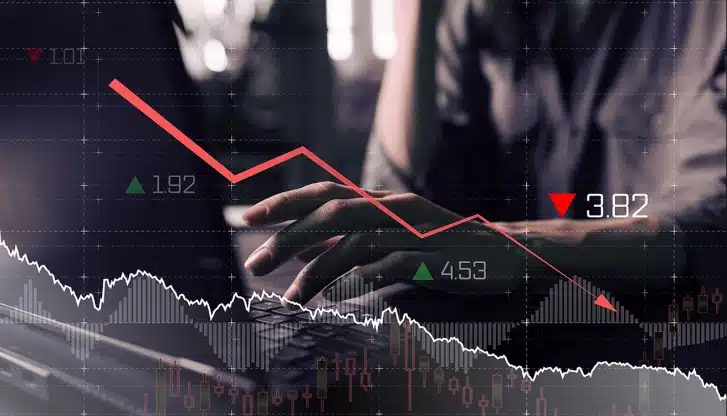
When recognizing signs of ATH, investors need to apply forecasts in technical analysis such as Fibonacci and Moving Average (MA). Specifically:
Measure price momentum
This method is like imagining the market as a spring. For the market to reach ATH, it needs to go through a price correction or decline to build momentum and establish higher price levels in the future.
Apply Fibonacci
Fibonacci is a popular tool in technical analysis based on a number sequence starting from 0 and 1, with subsequent numbers being the sum of the two preceding ones. Common ratios that most investors use are: 23.6%, 38.2%, 50%, 61.8%, 78.6%, and 100%. These points often act as support and resistance levels as they are horizontal on the chart.
Refer to Moving Average (MA)
Moving Average (MA) is a tool used to predict potential future price fluctuations. If the price of an asset is below the MA line, it may be in a downtrend, and vice versa.
Related: What is Metamask? Step-by-step guide to installing Metamask
Trading rules

Approaching the ATH point, it seems that the resistance level has vanished, however, there are still clear resistance factors, ready to create surprises for investors during the technical analysis process. After the price has increased to ATH, the market has absorbed most of the available supply. However, afterwards, the price may have to go through a prolonged testing or adjustment period, which may last from weeks to even months.
This process often results in losses for inexperienced investors. However, these risks can be minimized by adhering to the following rules:
Analyze the price breakthrough process
The price breakthrough process typically occurs in three specific stages.
- First is the “action” stage, where the price surpasses the resistance level and attracts higher-than-average trading volume, marking the beginning of a new phase.
- The second stage, “reaction,” often occurs when the growth momentum begins to wane, leading to weaker buying pressure, which may result in a price decline and a test of the breakout’s sustainability.
- Lastly, the “resolution” stage is the result of the previous two stages, where there is a significant change in buying and selling momentum, determining whether the breakout trend is confirmed.
Consider the price structure patterns
Identify basic candlestick patterns appearing just below the breakout point, often round or square bottom patterns, to confirm the breakout trend.
Identify the location of potential new resistance levels
Use Fibonacci from the lowest point to the breakout point to identify potential new resistance levels, such as 1.270, 1.618, 2.000, and 2.618, which are important levels to watch.
Set a profit protection level
Determine the minimum profit level you want to achieve and set a profit-taking point if the price trend reverses, based on percentage ratios or absolute values.
Exercise caution when increasing positions
Increase positions only when there is a favorable risk/reward ratio and the price is at the support level of the moving average.
Adhering to these rules can help investors optimize profits and minimize risks when trading at ATH.
What should investors do when in an ATH position?
When in an ATH position, it’s important to understand the meaning of ATH. Investors need to decide whether to sell all assets to take profits or only sell a portion of the assets. Here are some useful tips from Infina:
If investors hold all assets
If you are a long-term investor, believe in value, and aren’t overly concerned about ATH, you can continue to hold all of your assets. However, this decision should be based on careful analysis to determine whether the current ATH is temporary before making a decision.
If investors sell a portion of assets
Most investors usually choose this option. In this scenario, investors often use Fibonacci extensions to measure psychological resistance levels and decide whether to sell some assets or not. It’s crucial to identify the previous bottom that created the old ATH and the bottom that created the latest ATH.
If investors sell all assets
Investors still use Fibonacci analysis to make decisions. If Fibonacci extensions coincide with the ATH price, it may indicate that the upward price trend may end in the future. In that case, selling all assets to maximize profits may be a reasonable choice.
Conclusion
ATH in Crypto plays an important role in assessing market conditions and making decisions that are suitable for each individual’s investment goals. Have you ever encountered a trading situation when ATH appeared? Share your thoughts and experiences on managing positions in this situation. All contributions are appreciated and will help us learn and develop in the field of investment. Leave a comment below!
 OMN
OMN  BTC
BTC  ETH
ETH  USDT
USDT  XRP
XRP  BNB
BNB  SOL
SOL  USDC
USDC  TRX
TRX  DOGE
DOGE 





The article is really good for upcoming investors to always check so as not to buy an asset when it has already been oversold thanks
Very interesting and enlightening piece, you did amazing explaining the concept….ATH’s are usually tempting as many greedy or inexperienced investors loose money while hoping for more profit.
Every serious investor will have to decide when to make a profit in the market. It is impossible to take all the profit in the market because the profit is not for you alone. As for me, as long as I have hit my profit target in the bull run period I leave. Let Bitcoin be sold for 1m after I exit I don’t care.