Have you ever found yourself entranced by the ebbs and flows of the financial markets? Do you want to uncover the secrets behind these repetitive cycles of ups and downs? Elliott Waves might just be the method you need to easily grasp market trends. Let’s explore what Elliott Waves are and how they can help you conquer the financial markets seamlessly!
What are Elliott Waves?
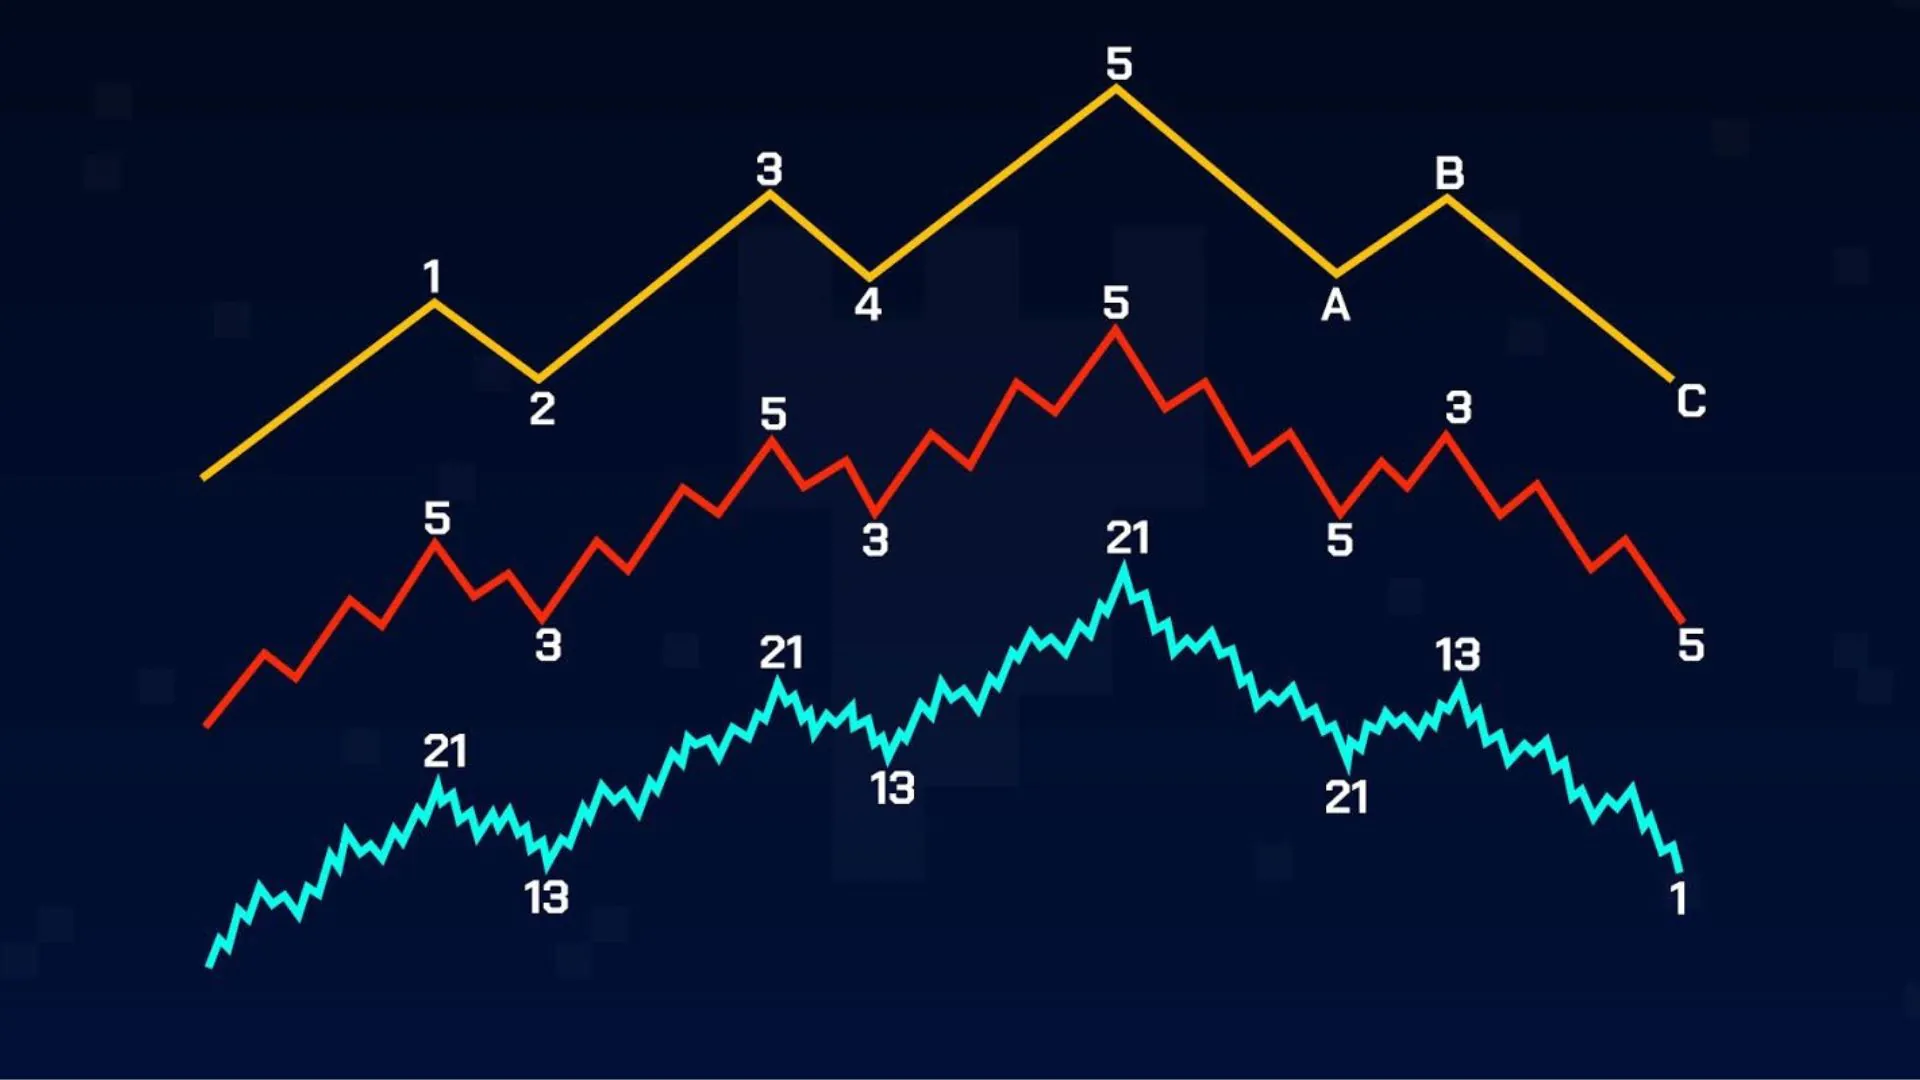
Elliott Waves are a theory in financial market technical analysis, developed by Ralph Nelson Elliott in the 1930s. This theory posits that financial markets move in predictable cycles based on the principle that the crowd psychology of investors and traders is reflected in prices.
Elliott Waves not only provide an approach to analyze price fluctuations but also help predict the next trends of the market based on repeating wave patterns. However, applying this theory requires expertise and deep understanding of the financial markets, and many traders use it only as one of many tools in their analytical toolbox.
Structure of Elliott Waves
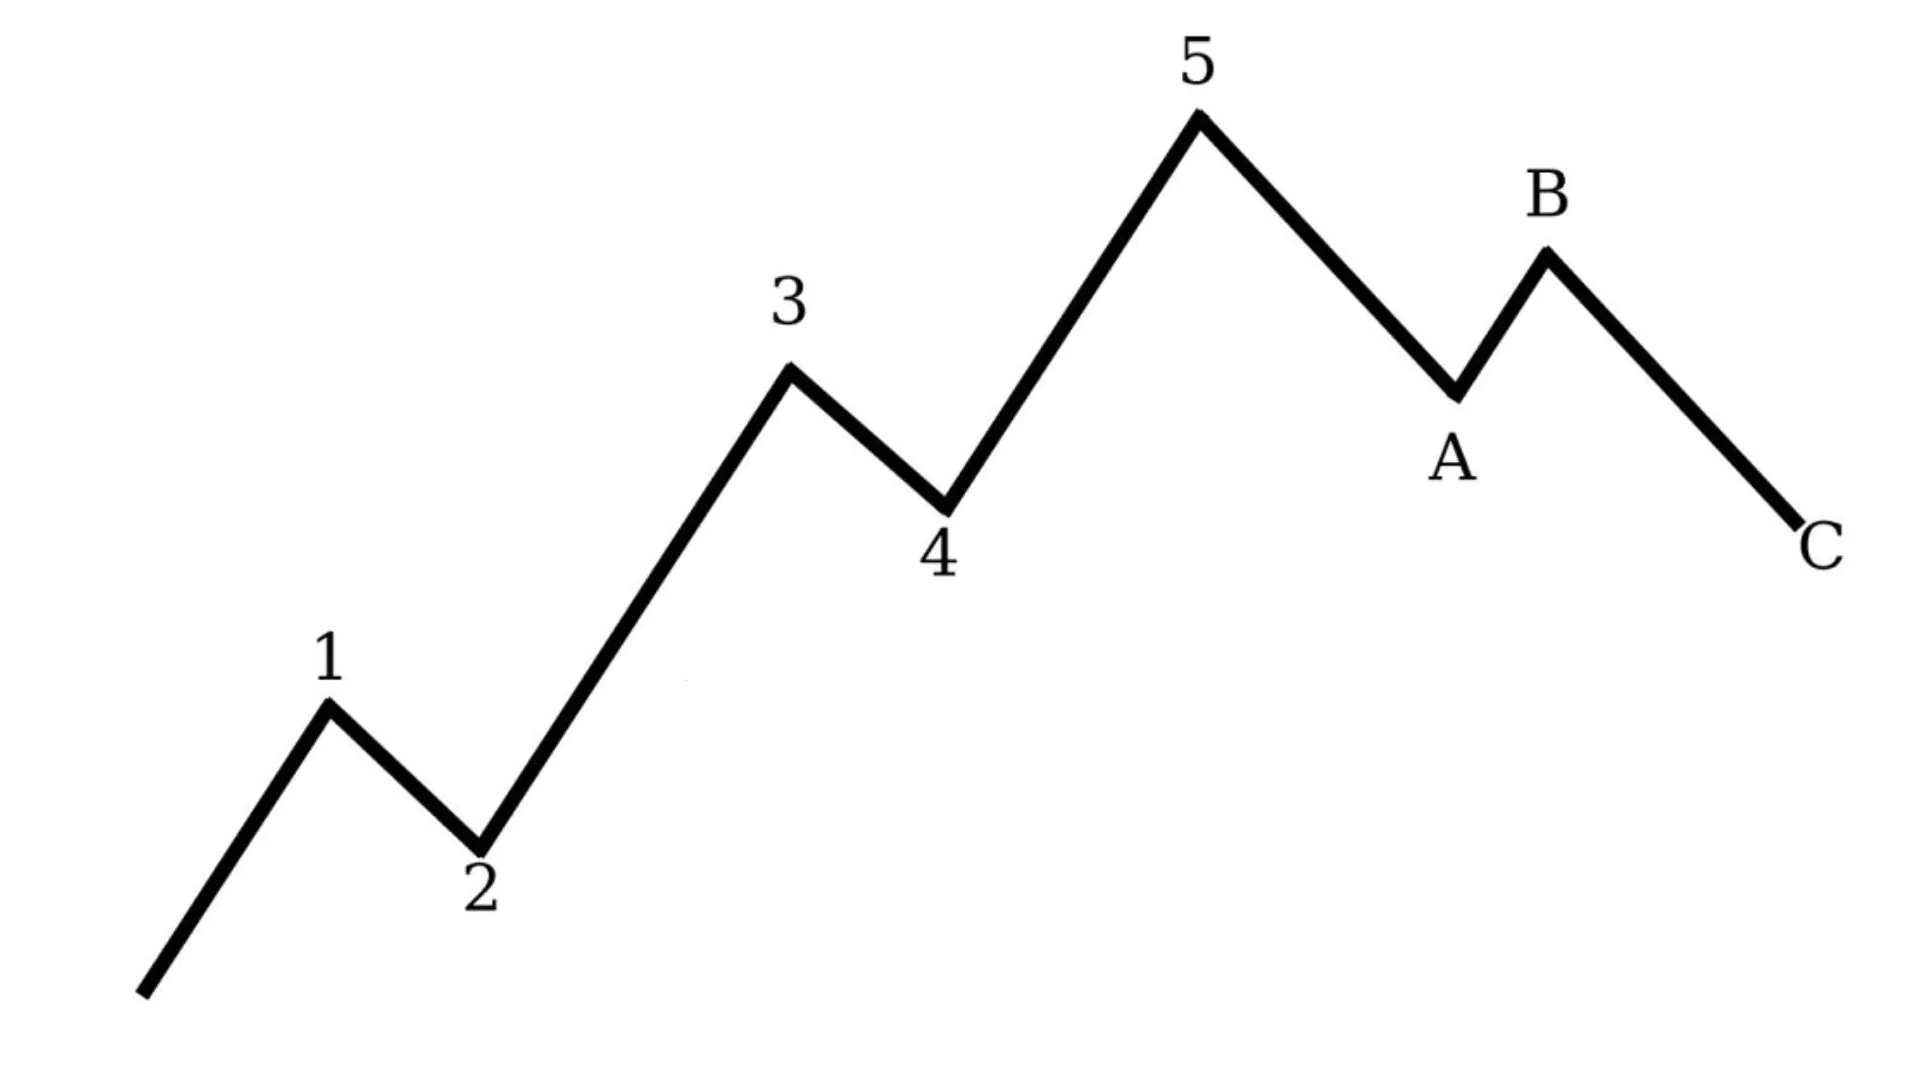
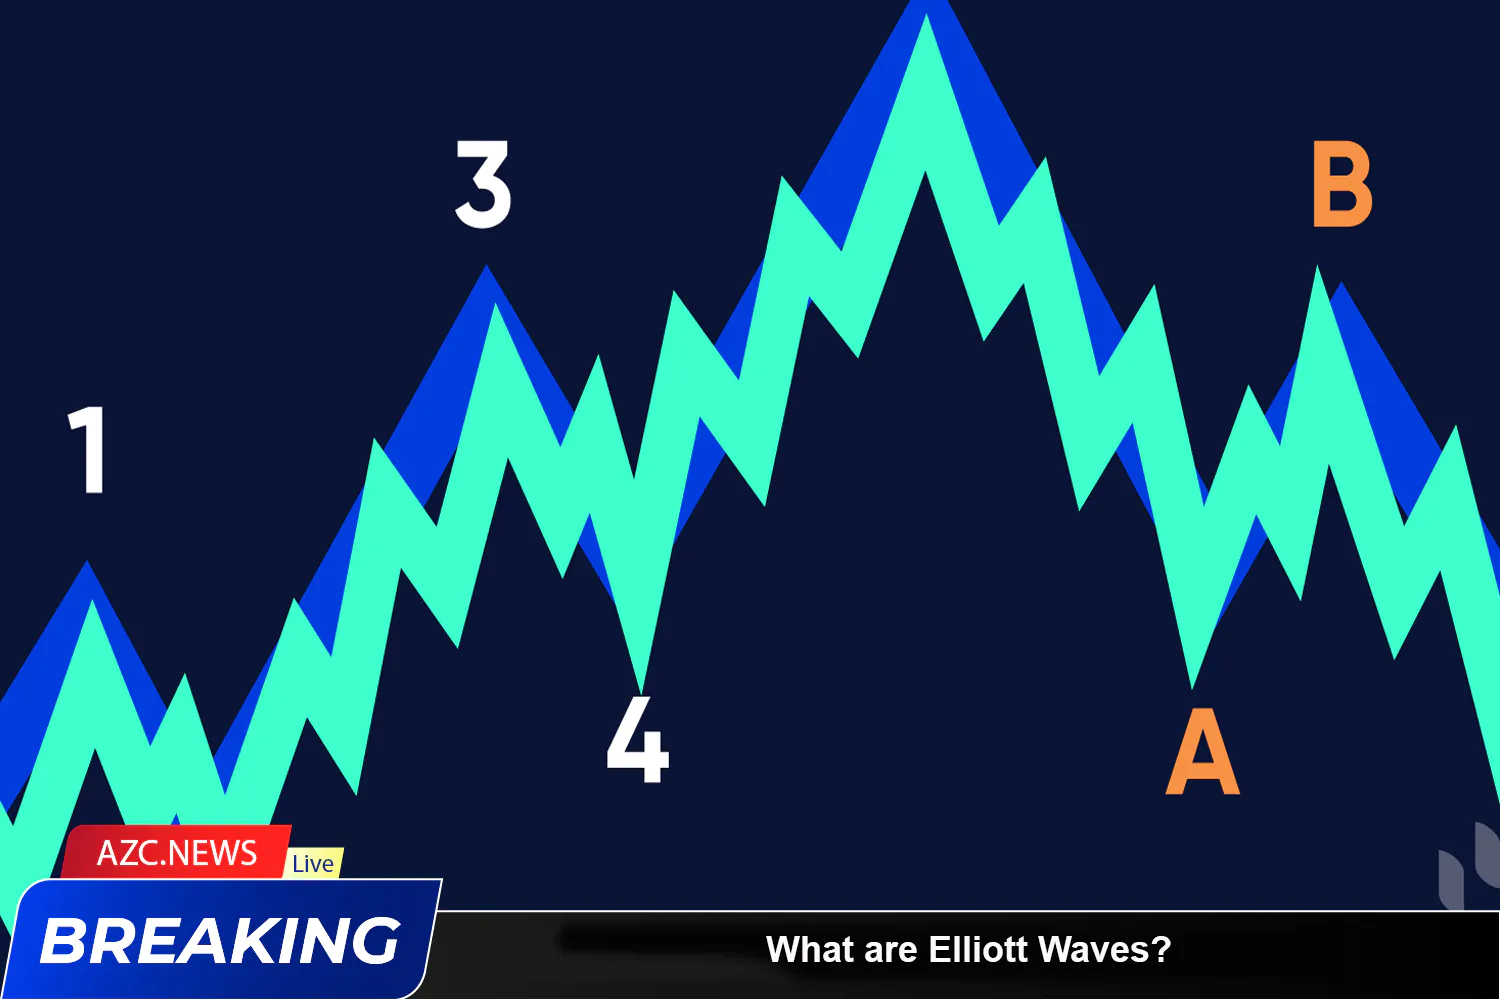
The structure of Elliott Waves resembles a chain of interconnected waves. A complete Elliott wave cycle reflects the coordination between two main types of waves: impulse waves and corrective waves. Each Elliott cycle consists of 5 impulse waves occurring along the main trend of the market and 3 corrective waves adjusting that trend’s direction.
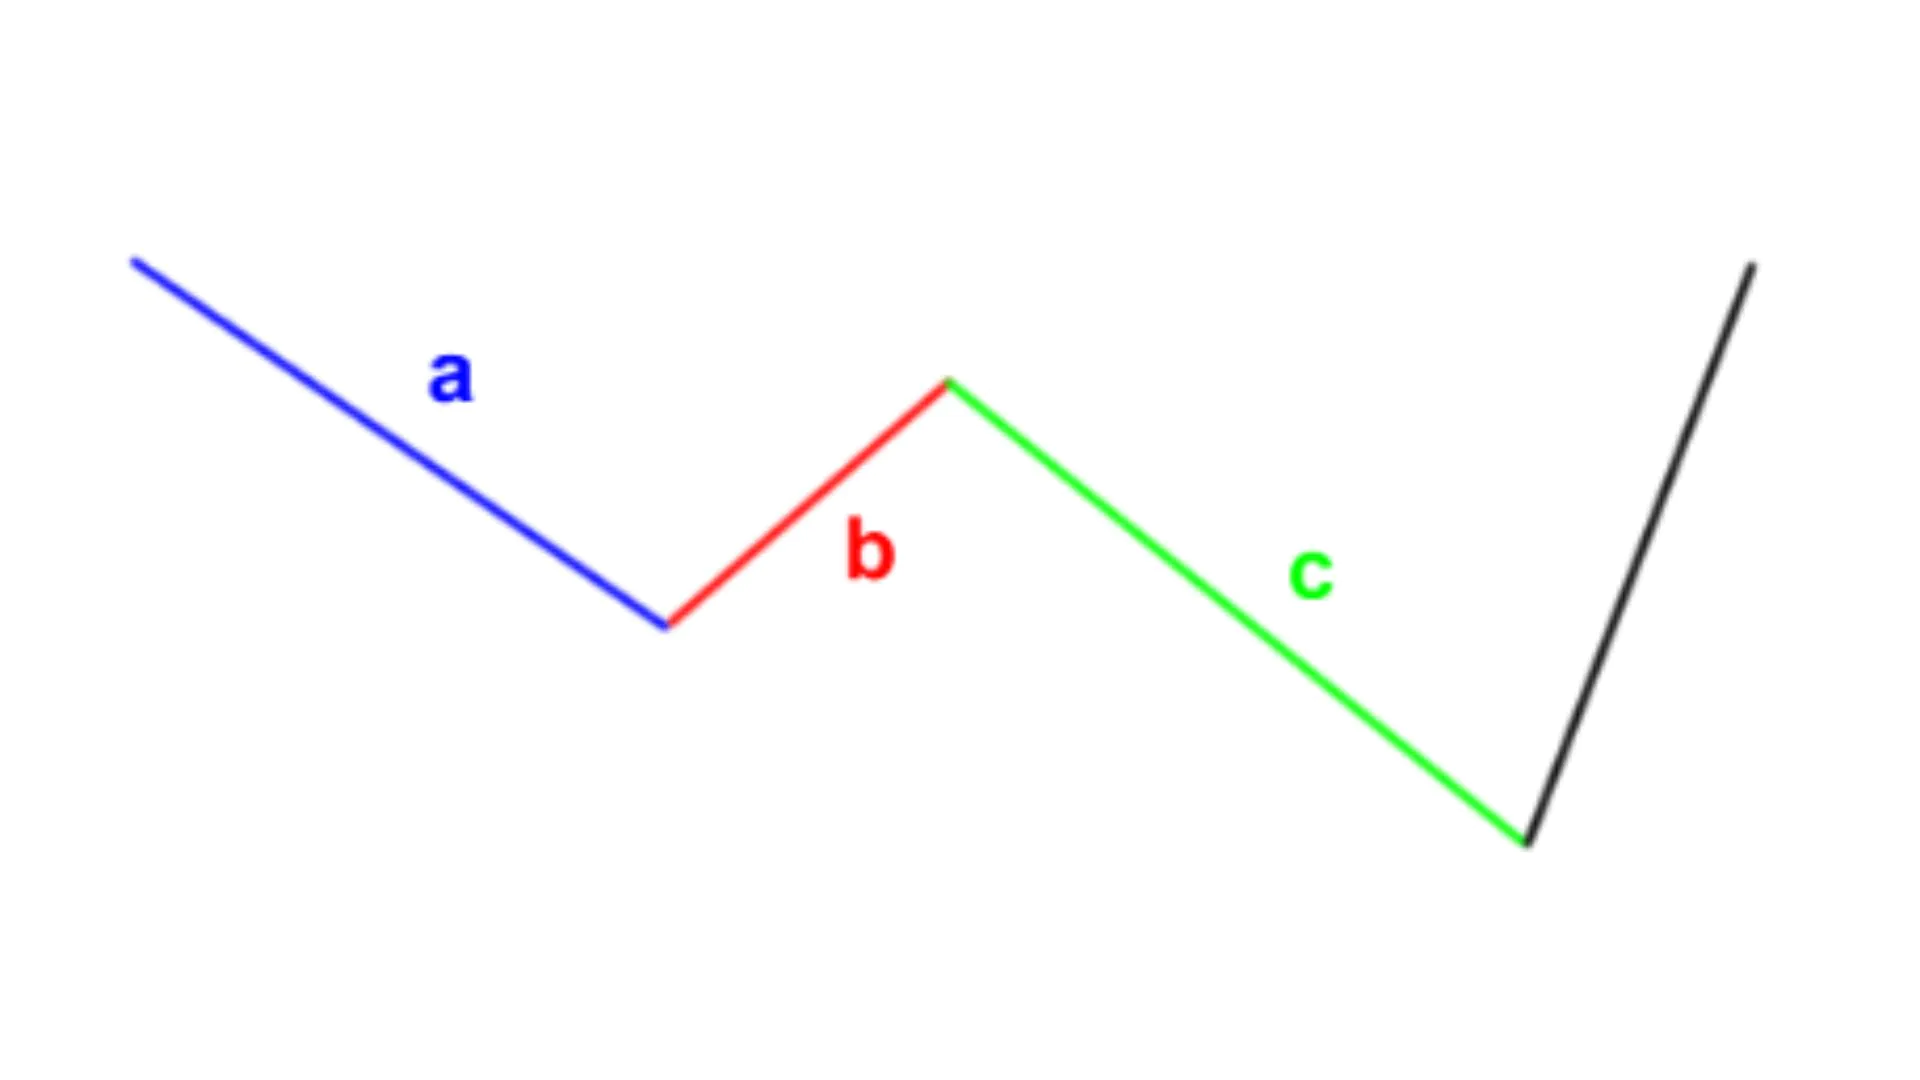
In the Elliott Wave model of 8 waves, waves 1, 3, 5 are impulse waves, following the main trend, while waves 2, 4 are corrective waves, moving in the opposite direction. As for the 3 corrective waves A, B, C, waves A, C are downward waves, while B is an upward wave.
Elliott Wave 1
- Wave 1 marks the beginning of an uptrend cycle.
- It’s typically the smallest and least recognized wave.
- This often occurs after the market has undergone a period of consolidation or price decline.
- This wave usually starts when some sensitive investors recognize the potential of a new investment opportunity.
Elliott Wave 2
- Wave 2 is a downward corrective wave following the first uptrend wave.
- It’s usually part of a temporary market correction.
- In this wave, prices may decline partially or entirely from wave 1, diminishing investors’ optimism.
- Some new investors may see this as an opportunity to enter the market.
Elliott Wave 3
- Wave 3 is the strongest wave and often the largest uptrend wave in the cycle.
- It often garners significant interest from investors.
- In this wave, prices typically rise strongly and may surpass the high point of wave 1.
- Many investors join the market in this wave due to confidence in the upward trend.
Elliott Wave 4
- Wave 4 is a downward corrective wave following a strong uptrend.
- It’s usually a time for the market to catch its breath after the strong rise of wave 3.
- This wave may reduce some of the price gains in wave 3 but often doesn’t go below the low of wave 1.
- Investors may become more negative and cautious in this wave.
Elliott Wave 5
- Wave 5 is the final wave of the uptrend cycle.
- This may be the time when the newest investors enter the market.
- This wave may see the final price increase, often accompanied by optimism or warnings of the cycle’s peak.
- There may be an increase in negative indicators or weakness in the upward trend in this wave.
Elliott Wave A
- Wave A is the first part of a downtrend wave cycle.
- It’s usually the first downward wave in a three-wave structure (ABC).
- This wave often begins after a significant uptrend ends, and the market starts to correct.
- In this wave, prices typically decline sharply, and some unpredictable fluctuations may occur.
- Wave A often ends at a new low compared to the peak of the previous uptrend cycle.
Elliott Wave B
- Wave B is the second part of the three-wave structure (ABC).
- It’s typically a temporary corrective wave after wave A.
- In this wave, prices usually rise back from the bottom of wave A, creating part of the recovery from the previous collapse.
- Wave B may make many investors more optimistic and create a sense that the downtrend has ended.
Elliott Wave C
- Wave C is the final part of the three-wave structure (ABC).
- It’s often the final downward wave in a downtrend cycle.
- In this wave, prices usually decline more sharply and may reach or exceed the bottom of wave A.
- Wave C often ends when negativity reaches its peak, making many investors negative and fearful about the market’s future.
9 Levels of Elliott Waves
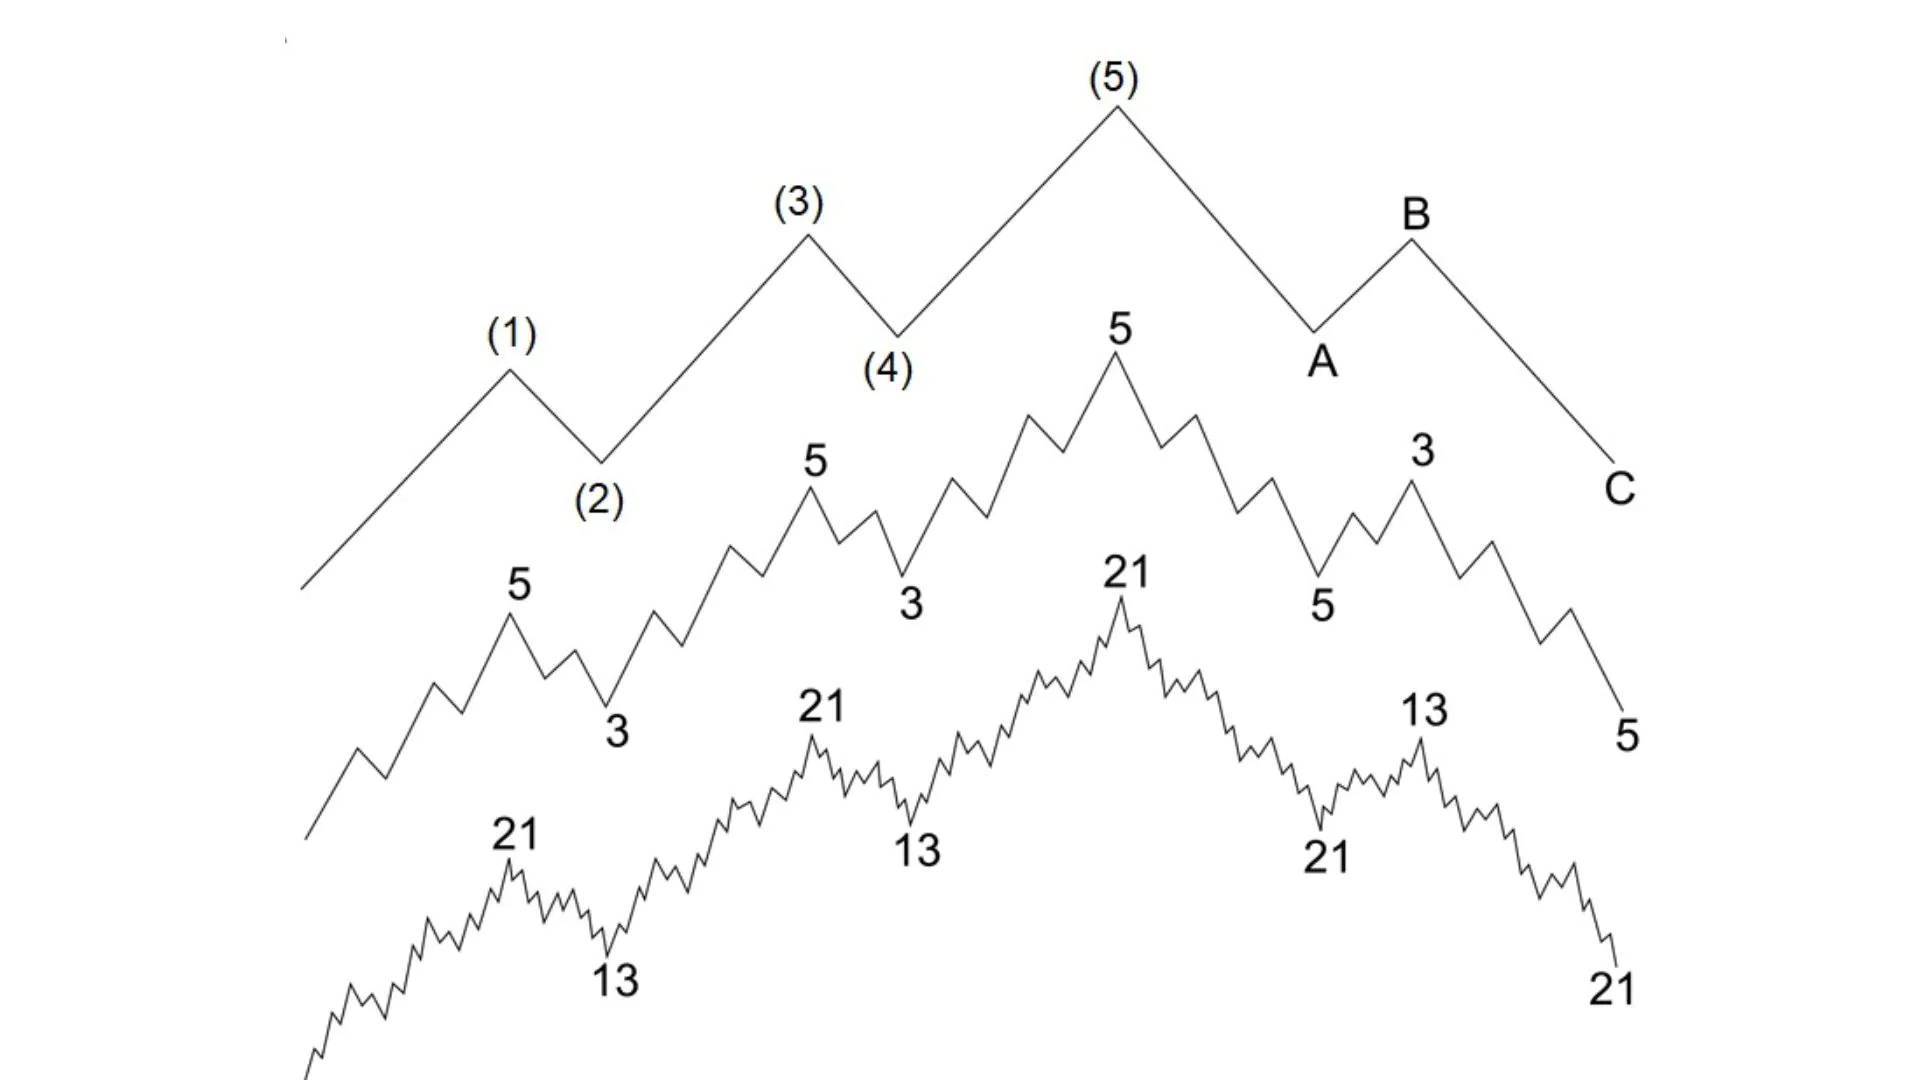
- Grand Supercycle: Often lasting decades or even centuries. Can have significant impacts on global markets and economies.
- Supercycle: Typically lasting from several years to decades. Can have significant impacts on national markets and economies.
- Cycle: Typically lasting from one year to several years. Can affect national markets and economies.
- Primary: Typically lasting from several months to 2 years. Are important parts of major uptrends or downtrends.
- Intermediate: Typically lasting from a few weeks to a few months. Are important parts of Primary waves.
- Minor: Typically lasting from several days to several weeks. Are parts of Intermediate waves or Primary waves.
- Minute: Typically lasting from several hours to a few days. Are parts of Minor waves or Intermediate waves.
- Minuette: Typically lasting from several minutes to a few hours. Are parts of Minute waves or Minor waves.
- Subminuette: Typically lasting only a few minutes or less. Are parts of Minuette waves or Minute waves.
6 Principles of Elliott Wave Operation

Elliott Waves reflect the influence of collective psychology on financial markets. Investor sentiment can fluctuate from optimism to pessimism, and vice versa, in a natural sequence. This transformation in sentiment not only creates price fluctuations in the market at all levels and times but also reflects trends and scales in trading activity. Here are the 6 main principles of Elliott Waves:
- Wave 2 should not exceed the low of Wave 1:
- In an uptrend cycle, prices should not fall below the low of the previous uptrend wave (Wave 1).
- In a downtrend cycle, prices should not rise above the high of the previous downtrend wave.
- Wave 3 should never be shorter than Wave 1:
- In an uptrend cycle, Wave 3 should never be shorter than Wave 1.
- In a downtrend cycle, Wave 3 should never be shorter than Wave 1.
- Wave 4 should not overlap with the top of Wave 1:
- In an uptrend cycle, Wave 4 typically does not overlap with the top of Wave 1.
- In a downtrend cycle, Wave 4 typically does not overlap with the bottom of Wave 1.
- Wave 4 should not exceed the peak of Wave 3:
- In an uptrend cycle, prices should not exceed the peak of Wave 3.
- In a downtrend cycle, prices should not fall below the bottom of Wave 3.
- Wave 5 can be subdivided into smaller waves:
- Wave 5 can be subdivided into smaller waves at lower market levels.
- Correction waves usually occur in three parts (A-B-C):
- In a downtrend cycle, correction waves are usually divided into three parts: Wave A, Wave B, and Wave C.
- Waves A and C typically move in the opposite direction to the main trend.
Related: What is DCA? 7 Effective DCA Steps to Help You Win in the Crypto Market
Exploring Advanced Elliott Wave Concepts
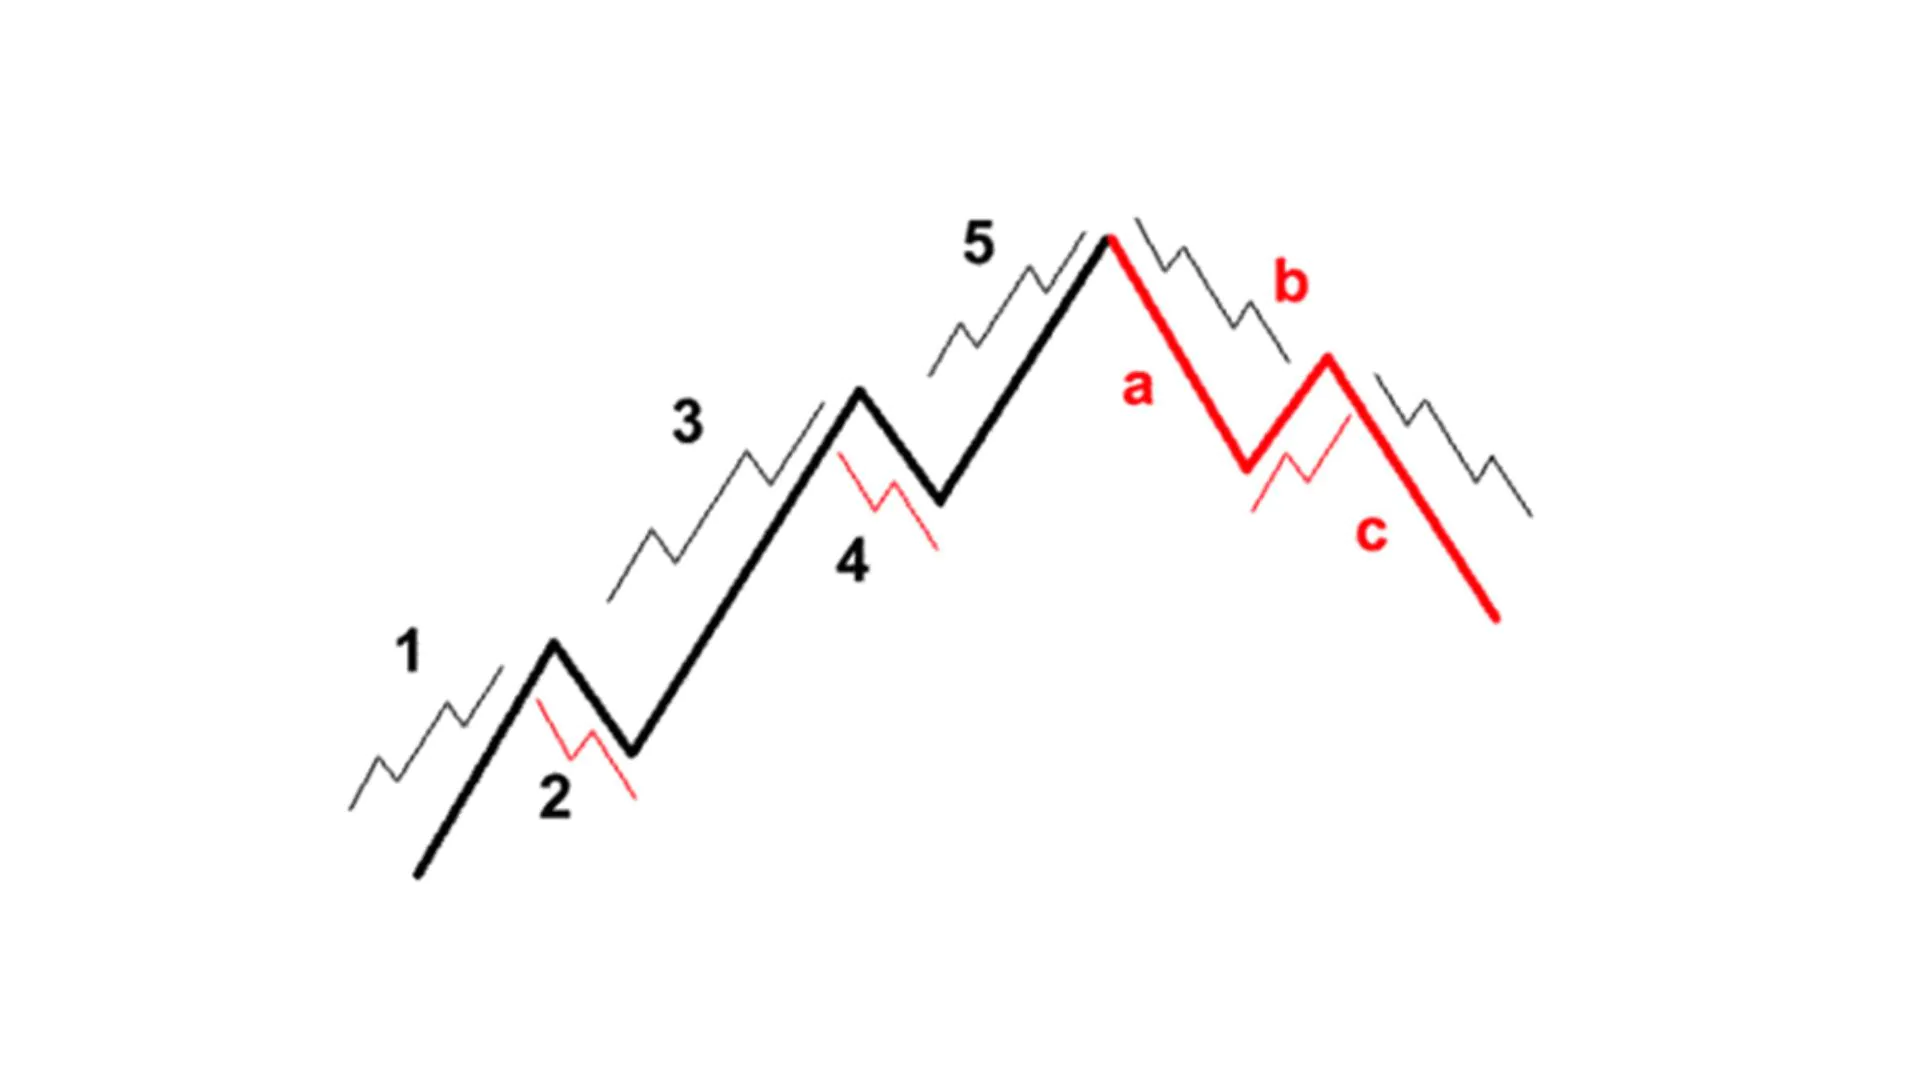
After understanding what Elliott Waves are, advanced Elliott Waves are more complex wave patterns than basic Elliott Wave models. Advanced Elliott Wave patterns often appear in volatile markets or when the market is at the end of a trend. Some common advanced Elliott Wave patterns include:
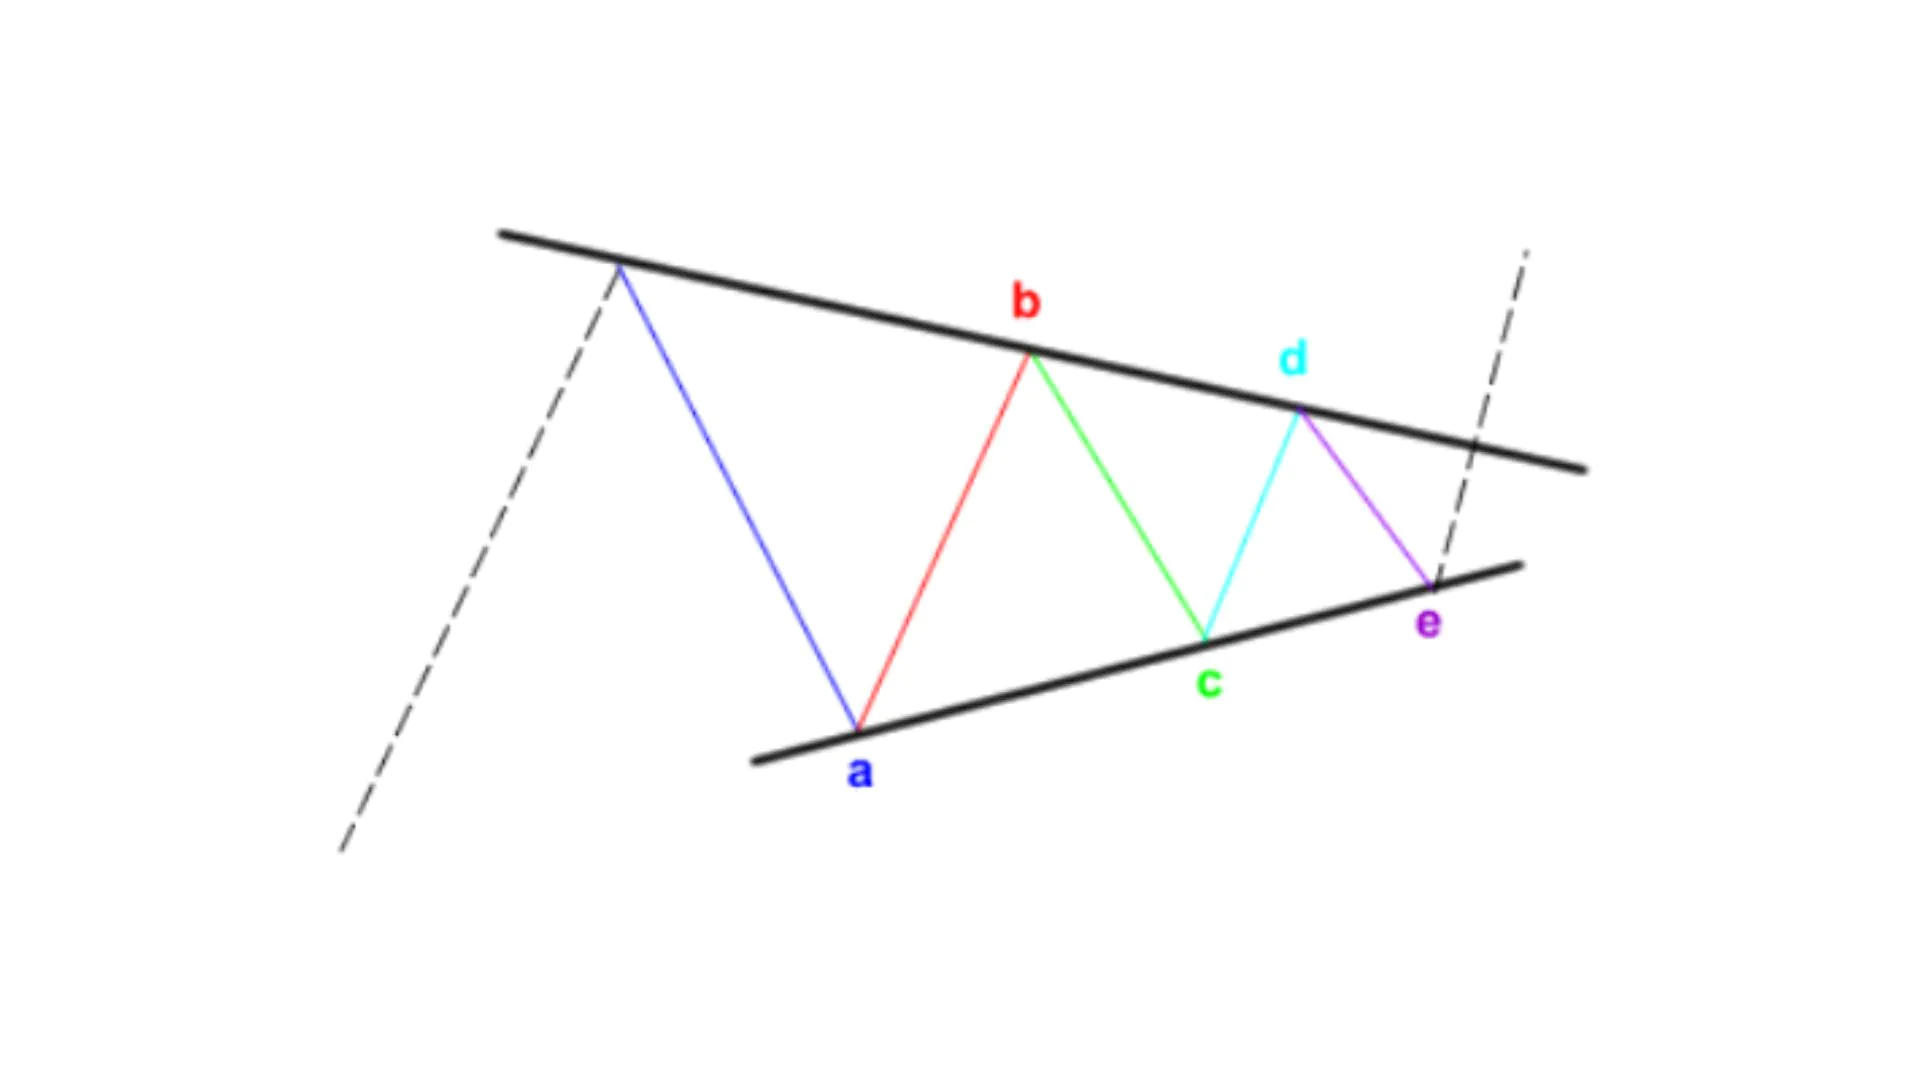
- Triangle Pattern: This is the most common advanced Elliott Wave pattern. The triangle pattern can be ascending, descending, or symmetrical. An ascending triangle is a bullish triangle pattern that often appears in an uptrend and signals the continuation of the uptrend. A descending triangle is a bearish triangle pattern that often appears in a downtrend and signals the continuation of the downtrend. A symmetrical triangle is a symmetrical triangle pattern that can appear anywhere in the market and may signal a trend reversal.
- Flat Pattern: Represented by a series of sideways corrective waves, a flat pattern often has lengths equivalent to each wave in the sequence.
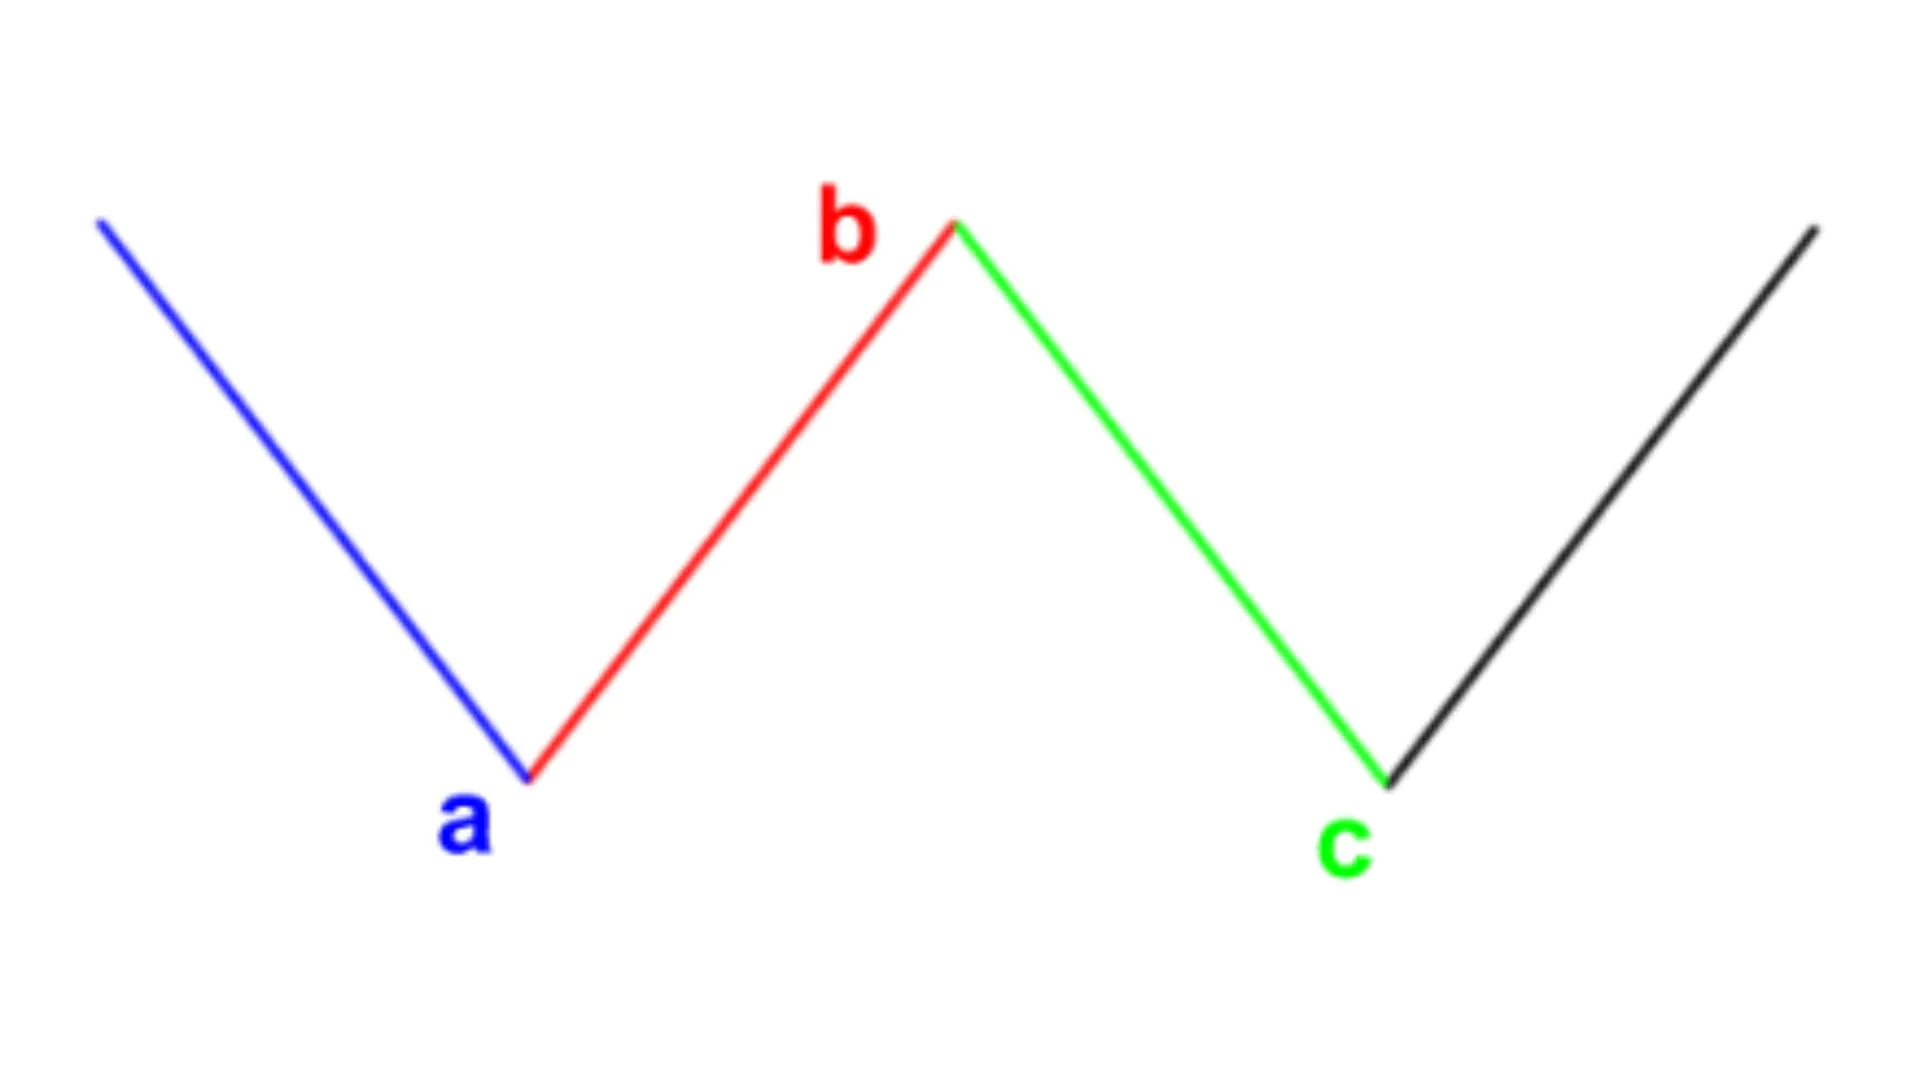
- Complex Zigzag Pattern: A complex zigzag pattern is an advanced Elliott Wave pattern consisting of 3 corrective waves and 2 impulse waves. A complex zigzag pattern may signal the end of a trend.
-
Complex Zigzag Pattern
Using advanced Elliott Waves can help you identify more accurate entry and exit points for trading. However, advanced Elliott Waves are also more complex and challenging to identify than basic Elliott Wave models. Therefore, you need to have more experience and knowledge of the financial markets before using advanced Elliott Waves. You need to practice Elliott Wave analysis thoroughly and repeatedly on platforms like TradingView to master it in investment strategies.
What’s the Relationship Between Elliott Waves and Fibonacci?
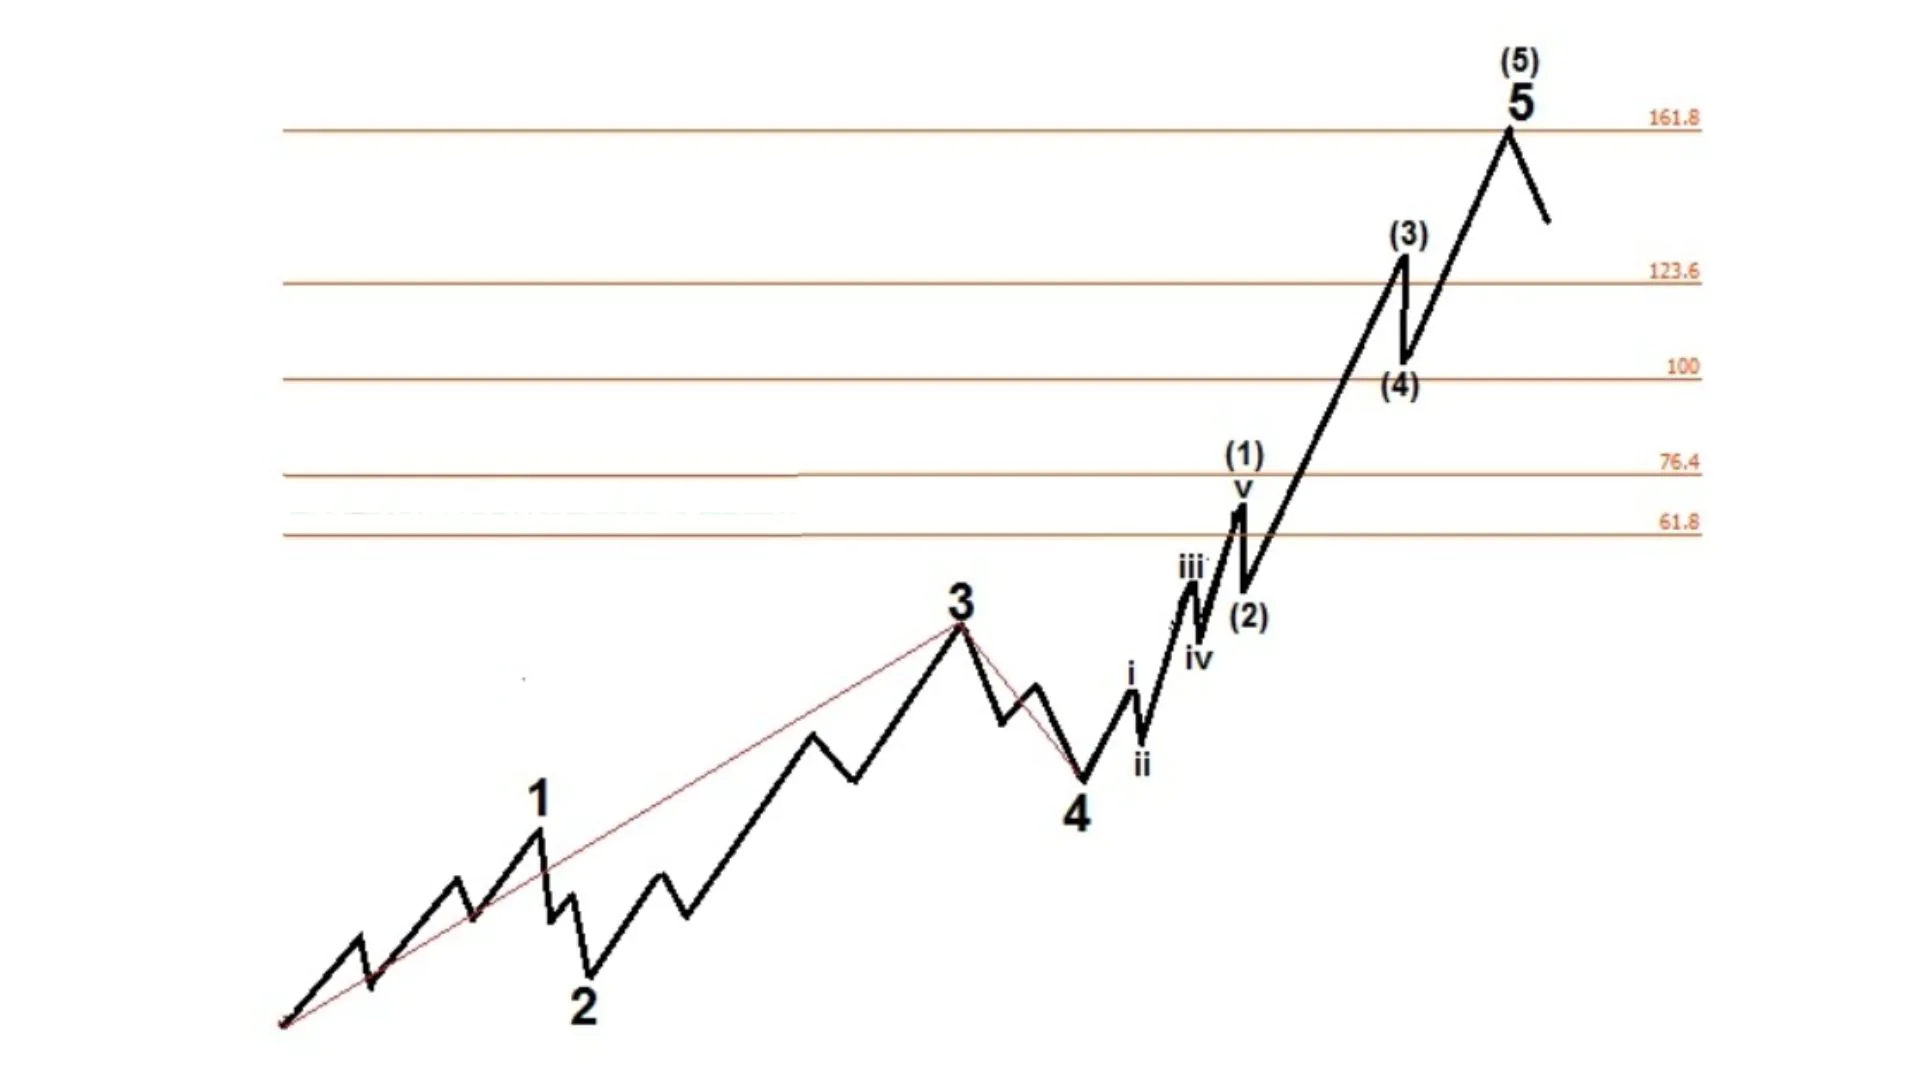
The relationship between Elliott Wave theory and Fibonacci is an integral part of technical analysis in the financial markets. Specifically, Fibonacci ratios are often used to identify potential price levels for waves and their peaks and troughs. Here are some ways in which Elliott Waves and Fibonacci interact:
- Fibonacci Ratios in Elliott Waves: Fibonacci ratios such as 0.618, 1.618, 0.382, and 0.786 are often used to identify potential price levels for Elliott Waves. For example, an uptrend correction wave may end at a price level near 0.618 or 1.618 of the length of the basic wave.
- Fibonacci Ratio Laws in Wave Degrees: Waves in Elliott Wave theory often reflect Fibonacci ratios in both size and time. For example, an uptrend wave may extend near some Fibonacci ratio of the previous wave’s length, or a downtrend correction wave may extend near 61.8% of the previous uptrend wave.
- Fibonacci Support and Resistance Levels: Fibonacci levels calculated using Fibonacci ratios are often used as significant support and resistance levels. Traders often use Fibonacci levels like 38.2%, 50%, and 61.8% to identify price areas where prices may reverse or continue.
- Identifying Wave Peaks and Troughs: Fibonacci ratios are often used to identify wave peaks and troughs in Elliott Wave theory. When prices reach an important Fibonacci level, a reversal or continuation of the trend may occur, depending on the market context.
In summary, the relationship between Elliott Wave theory and Fibonacci provides a powerful and flexible approach to analyzing and predicting price fluctuations in the financial markets. The combination of these two methods can provide valuable information and create attractive trading opportunities.
Effective Elliott Wave Trading Guide

Effectively trading with Elliott Waves requires investors to accurately identify wave patterns and rules, while applying appropriate guidelines to make predictions and trading decisions.
First, investors must be able to count waves and identify them according to operational rules. This requires continuous practice to master the basic rules and accumulate experience.
Second, analyze the chart across multiple timeframes to be able to consider the overall market. Assessing the overall chart, from recent fluctuations to longer periods, helps investors accurately evaluate the market position and where the current Elliott Wave is.
Finally, wait for confirmation from trading volume. Wave 3 has great potential for trading, but requires patience and waiting for reversal signals and volume confirmation. Elliott Waves often accompany price shifts, so the most important thing is the increase in trading volume through sessions.
Conclusion
Above is the complete knowledge about what Elliott Waves are. Elliott Waves are a powerful analytical tool in the toolbox of traders and investors. However, applying it requires technical knowledge and skills, as well as the patience to conduct accurate analysis.
Let me know if you need any further assistance!
 BTC
BTC  ETH
ETH  USDT
USDT  SOL
SOL  BNB
BNB  USDC
USDC  XRP
XRP  DOGE
DOGE  TON
TON  ADA
ADA 





Good