A crypto analyst has identified a bearish head and shoulders pattern, indicating that this altcoin could face further depreciation.
However, despite these challenges, TON holders remain undeterred, continuing to “buy the dip” and accumulate more tokens amid recent difficulties.
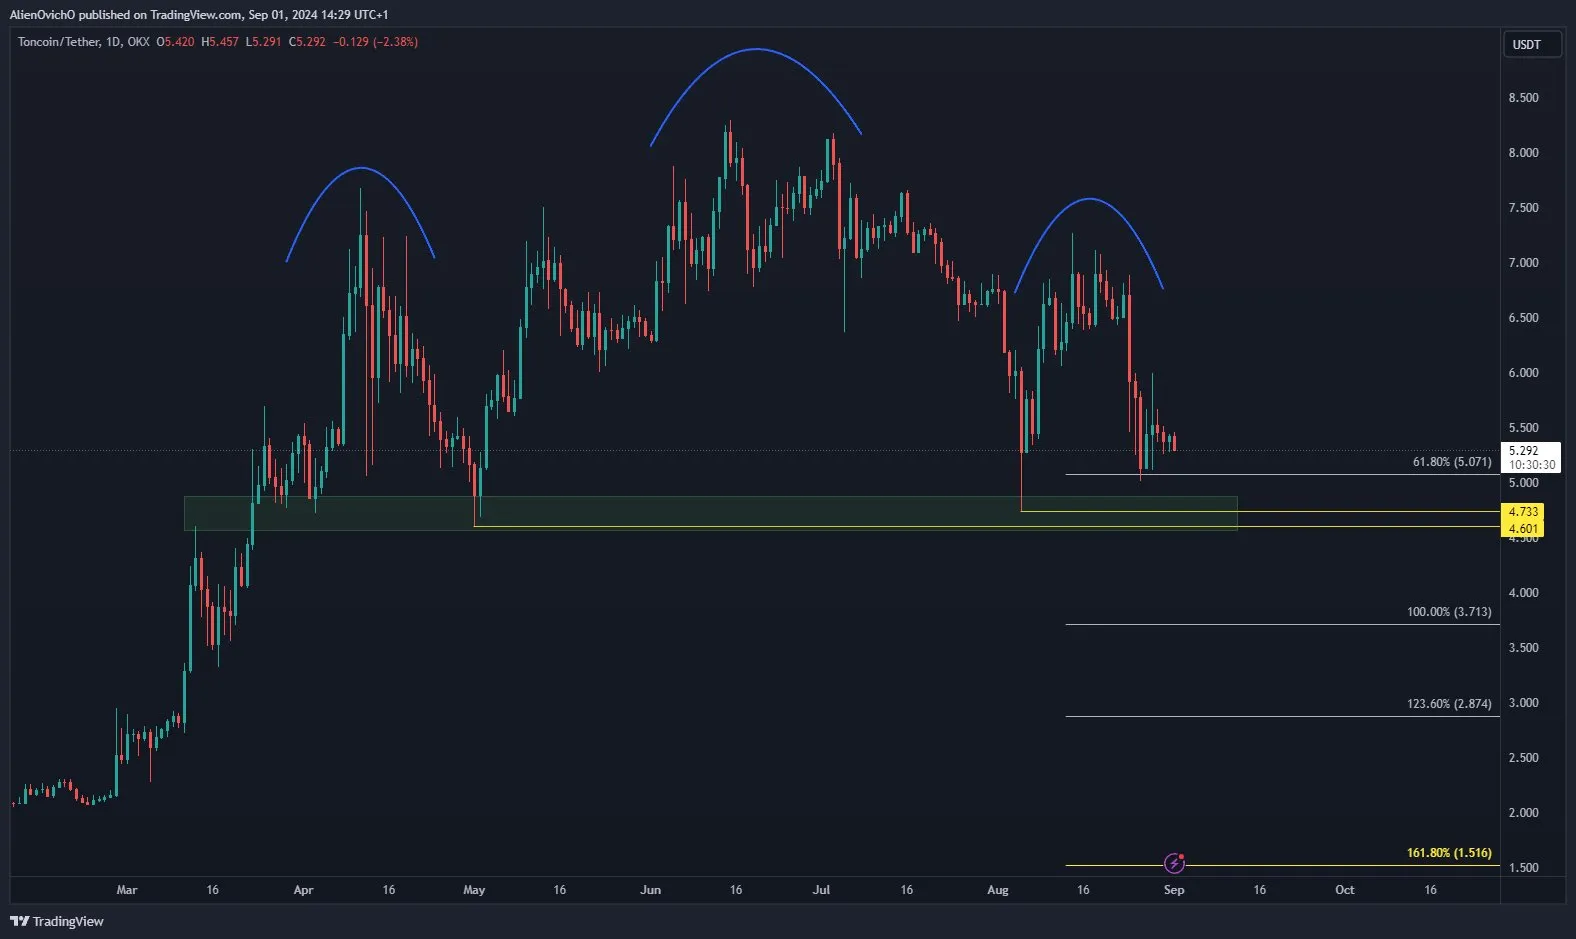
Toncoin bulls must defend the support level to prevent further price declines. In a recent post on X, crypto analyst and trader AlienOvichO shared technical analysis highlighting the formation of a head and shoulders pattern on TON’s daily chart.

The head and shoulders pattern is a crucial indicator of a potential trend reversal, consisting of three peaks: a shoulder, a head, and another shoulder, with the neckline acting as the support level. According to AlienOvichO, if TON breaks below this neckline, which is currently forming a support at $4.78, its value could continue to drop.
Although initiating a clear uptrend may prove challenging, the analyst noted that TON buyers must strive to maintain a sideways trend if they wish to prevent the bearish outcome.
AlienOvichO stated, “TON bulls need to take action to prevent this bearish structure from materializing, so the best way to avoid it is through a sideways movement in the coming weeks before making a strong push.”
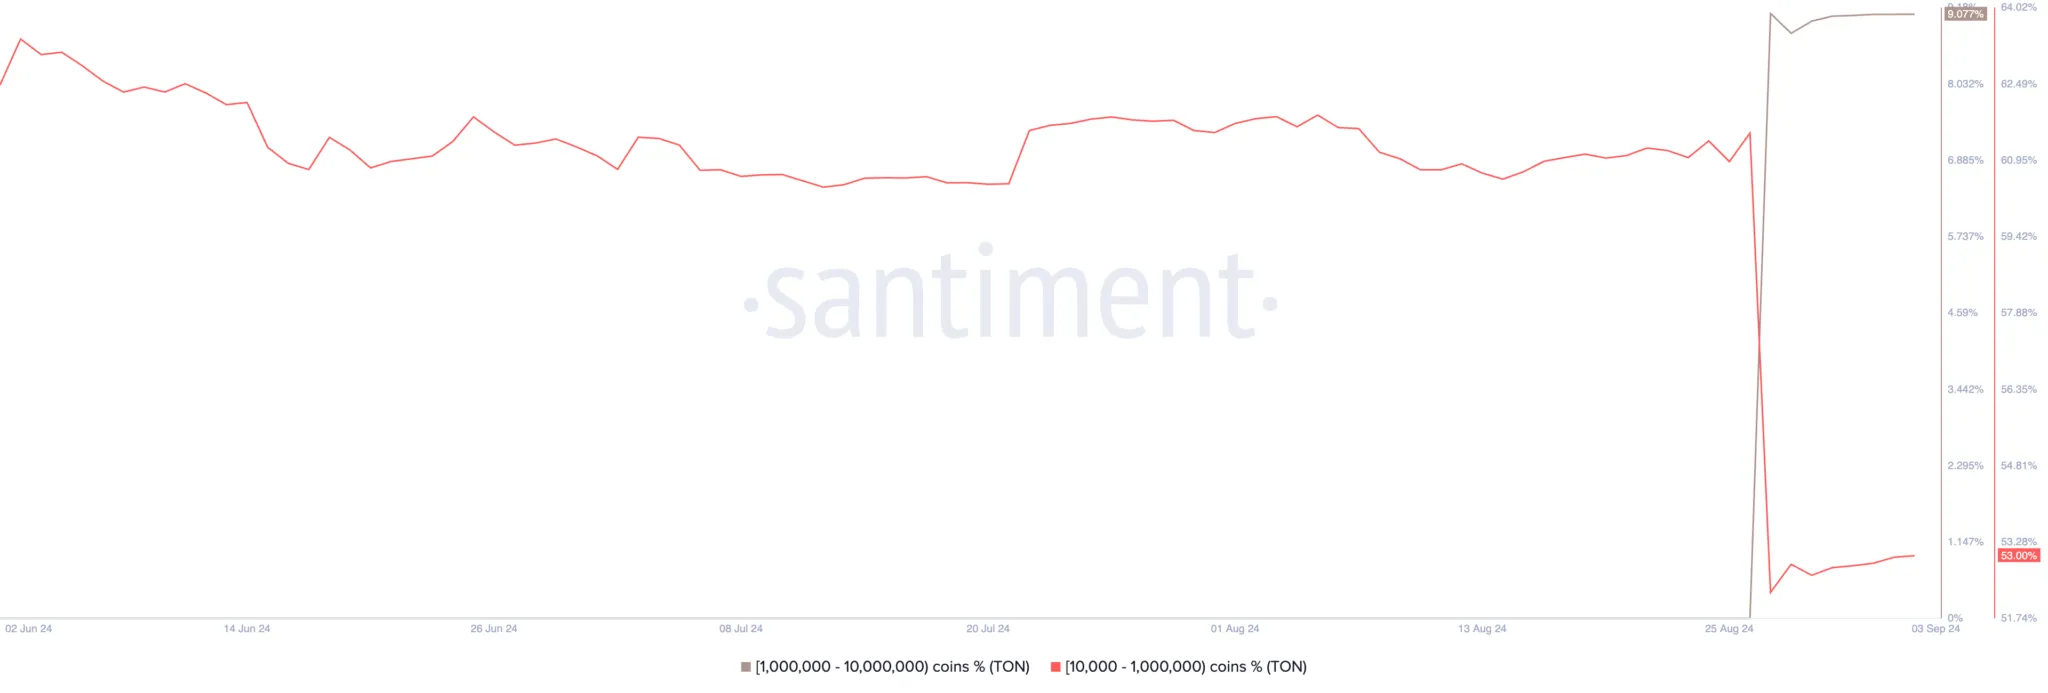
Interestingly, TON whales have viewed the recent price decline as a buying opportunity. According to Santiment data, these large holders have increased their TON holdings since Durov’s arrest. The group of whales holding between 1 million and 10 million TON tokens now controls 9.07% of the altcoin’s total circulating supply.

However, since Durov’s arrest, smaller wallets, particularly those holding between 10,000 and 1 million TON, have reduced their holdings. This shift suggests that while larger investors are accumulating, smaller holders may be losing confidence amid the ongoing uncertainty surrounding Toncoin.
TON Price Prediction: Token Heading Toward $3.76
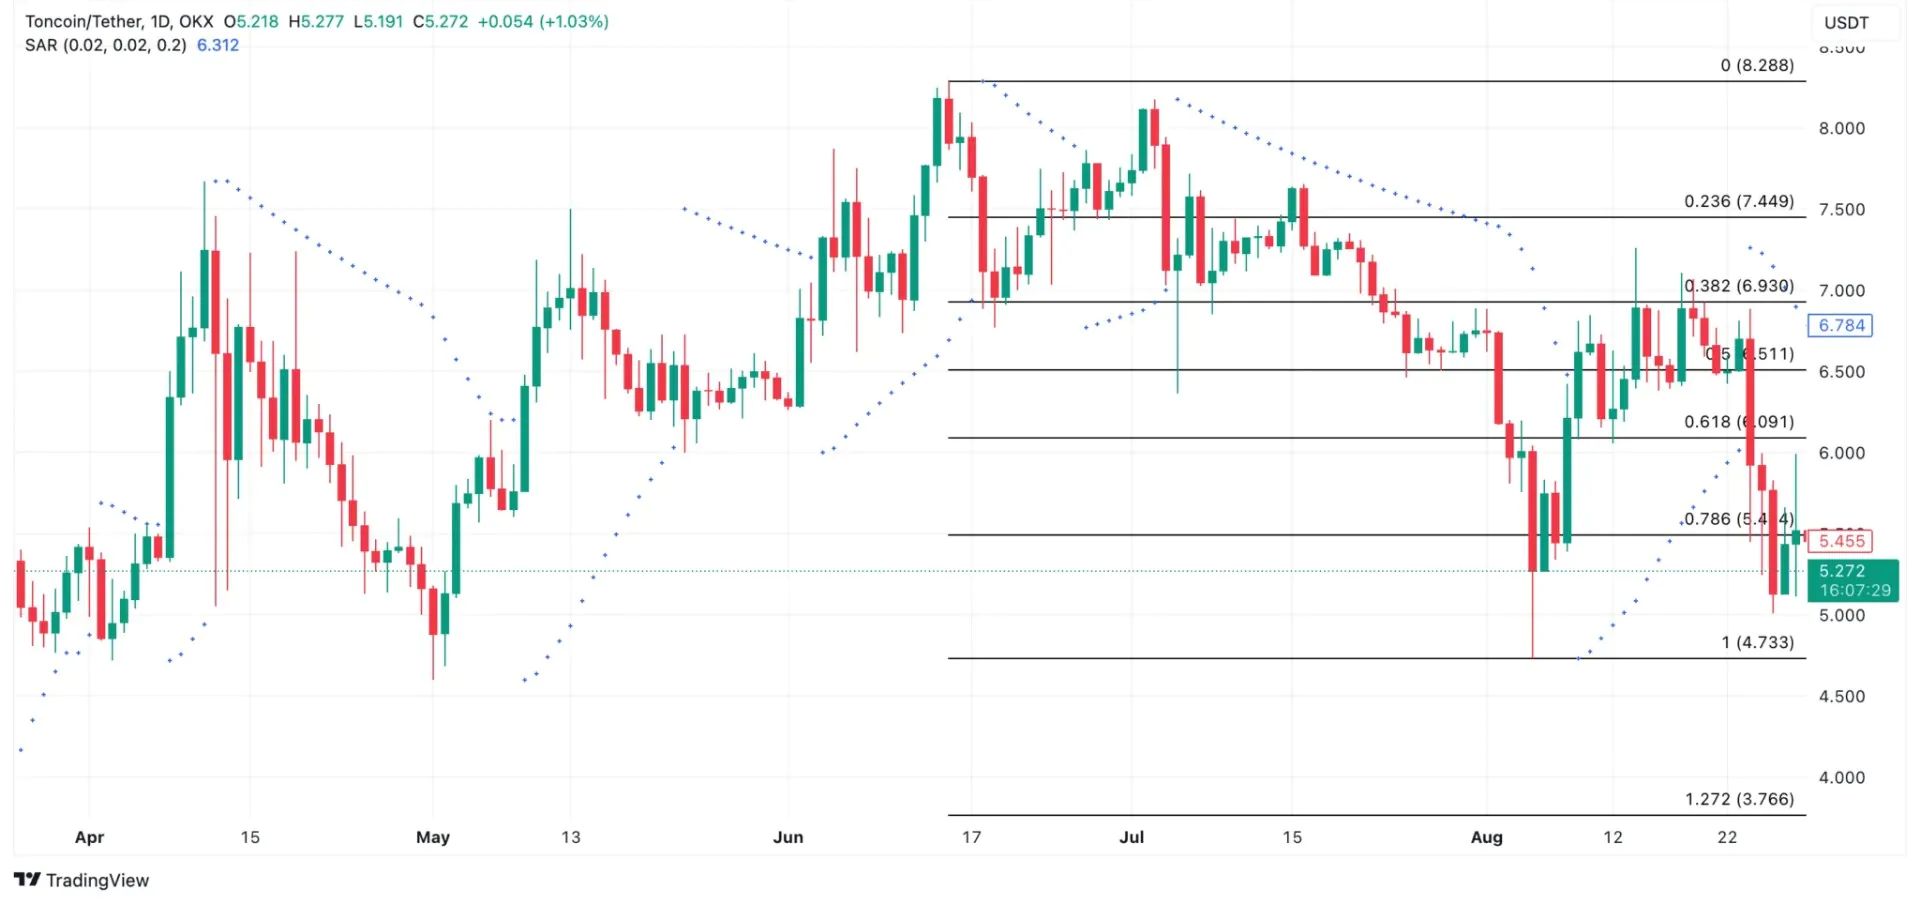
TON’s technical indicators align with AlienOvichO’s bearish outlook. The Chaikin Money Flow (CMF) is below zero at -0.10, indicating capital outflow and increasing selling pressure.
Additionally, the Parabolic Stop and Reverse (SAR) indicator for TON is showing dots above its price. The Parabolic SAR measures an asset’s trend direction and identifies potential reversal points. When its dots are positioned above the price, the market is in a downtrend, suggesting that the price could continue to decline.

If TON breaks below the $4.78 support level, its next price target is $4.73. Should buyers fail to defend this level, TON’s price could drop to $3.76, the lowest level it reached in March.
However, if the market trend shifts from bearish to bullish and whale accumulation triggers widespread demand for TON, its price could rise to $5.49.


