The broader cryptocurrency market has seen a significant slump following news of retaliatory tariffs, which dragged TRUMP below the critical $10 support level, resulting in a sharp 15% decline.
TRUMP Price Analysis and Key Levels to Watch

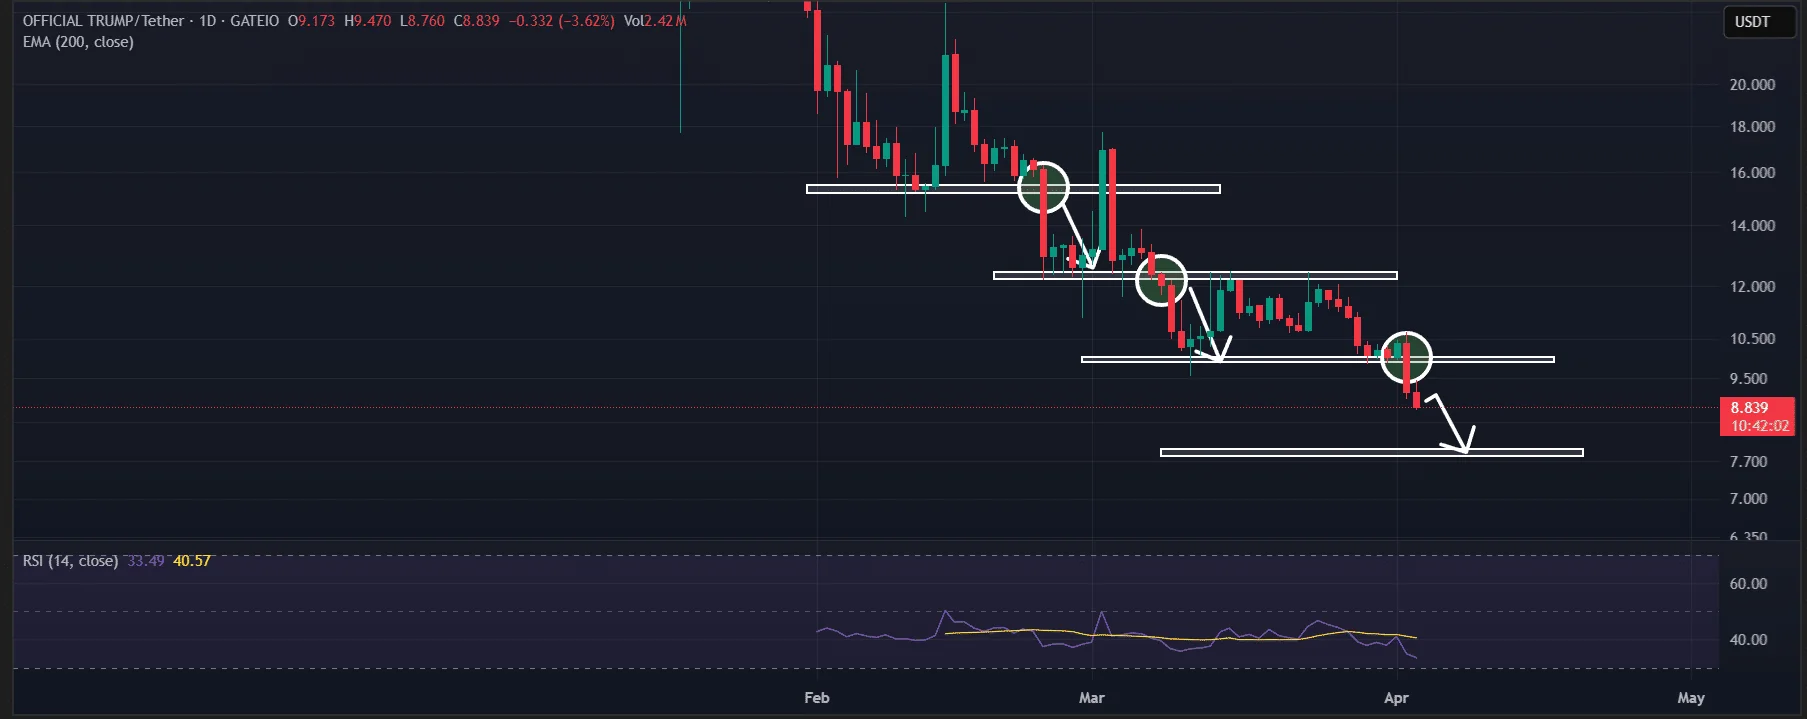
After losing this vital support, TRUMP appears to be repeating a familiar price pattern. The daily chart reveals that each time the memecoin consolidated and then broke its support, it recorded a substantial 18% decline.
This time seems no different. Since February 2024, TRUMP has experienced two such breakdowns, each followed by an 18% drop. Given the current market conditions, a third similar drop may be on the horizon.
If TRUMP continues to trade below the $10 or $9.50 mark, the likelihood of an additional 18% fall is high — potentially bringing the price down to $7.90.
At the time of writing, the Relative Strength Index (RSI) is hovering near the oversold zone, indicating weak buying momentum. TRUMP is currently trading around $8.80, down more than 15% in the past 24 hours alone.
Over $11 Million in Short Positions

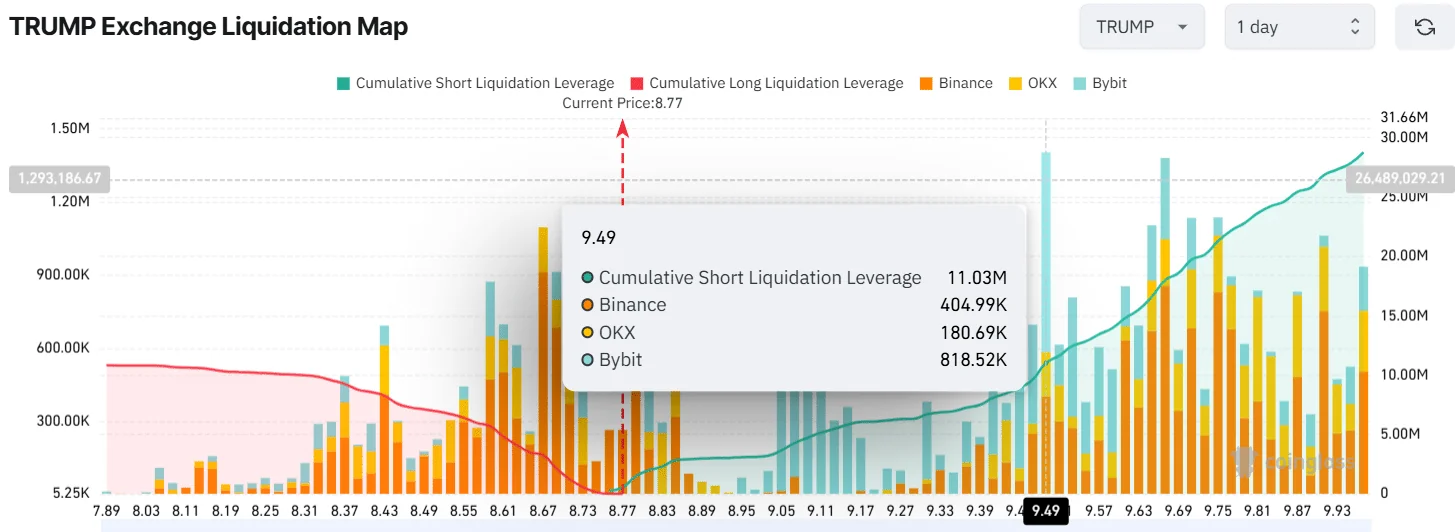
On-chain data suggests that most traders are betting against TRUMP, expecting the price to remain below $9.50 in the short term.
According to Coinglass, an on-chain analytics platform, traders are heavily leveraged, with positions clustered at $8.67 on the lower end and $9.49 on the higher end. In the past 24 hours, long positions totaled $3.25 million, while short positions surged to $11.03 million.
This excessive leverage, combined with widespread bearish sentiment, suggests that TRUMP may continue to fall until it finds a new support zone.
Whales Accumulating – Buying the Dip?
Interestingly, some whales and investors seem to be quietly accumulating TRUMP, likely following a buy-the-dip strategy.
Spot inflow/outflow metrics show that exchanges recorded TRUMP outflows worth over $4.65 million in the last 24 hours — a strong indicator of accumulation activity.


