Solana’s Technical Analysis and Upcoming Levels
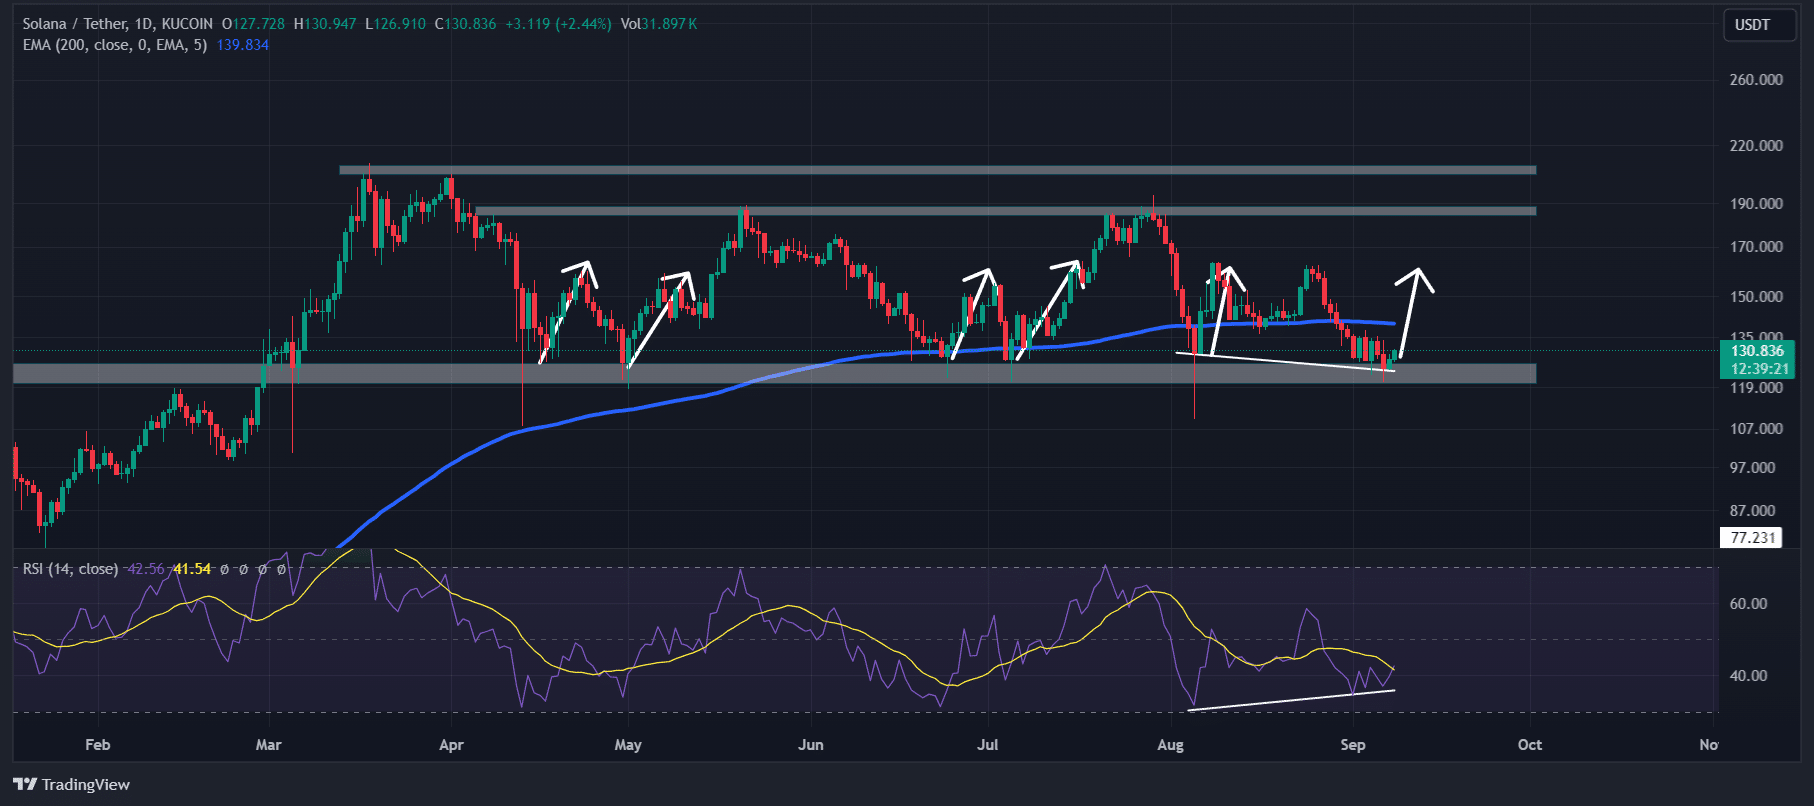
According to expert technical analysis, SOL shows bullish potential at the time of reporting. Its Relative Strength Index (RSI) has formed a bullish divergence, indicating a possible reversal from the current downtrend to an upward trajectory.
This divergence occurs when the asset’s price continues to create lower lows, while the technical indicator produces higher lows during the same period.
Historically, whenever SOL reaches its current support level, it tends to experience a substantial price surge. Given the current bullish price action, there is a strong possibility that SOL could see a 25% rally, pushing its price to around $160.

Bullish On-Chain Data
CoinGlass’ SOL Long/Short ratio chart reflects a bullish market sentiment. According to the data, the current ratio stands at 1.103, signaling that traders are leaning towards optimism (a value above 1 indicates bullish sentiment).
At the same time, SOL’s open interest has increased by 3% in the past 24 hours and has been steadily rising over the last three days.
The combination of rising open interest and a Long/Short ratio above 1 presents a potential buying opportunity. Traders often use this data to inform their long or short positions.

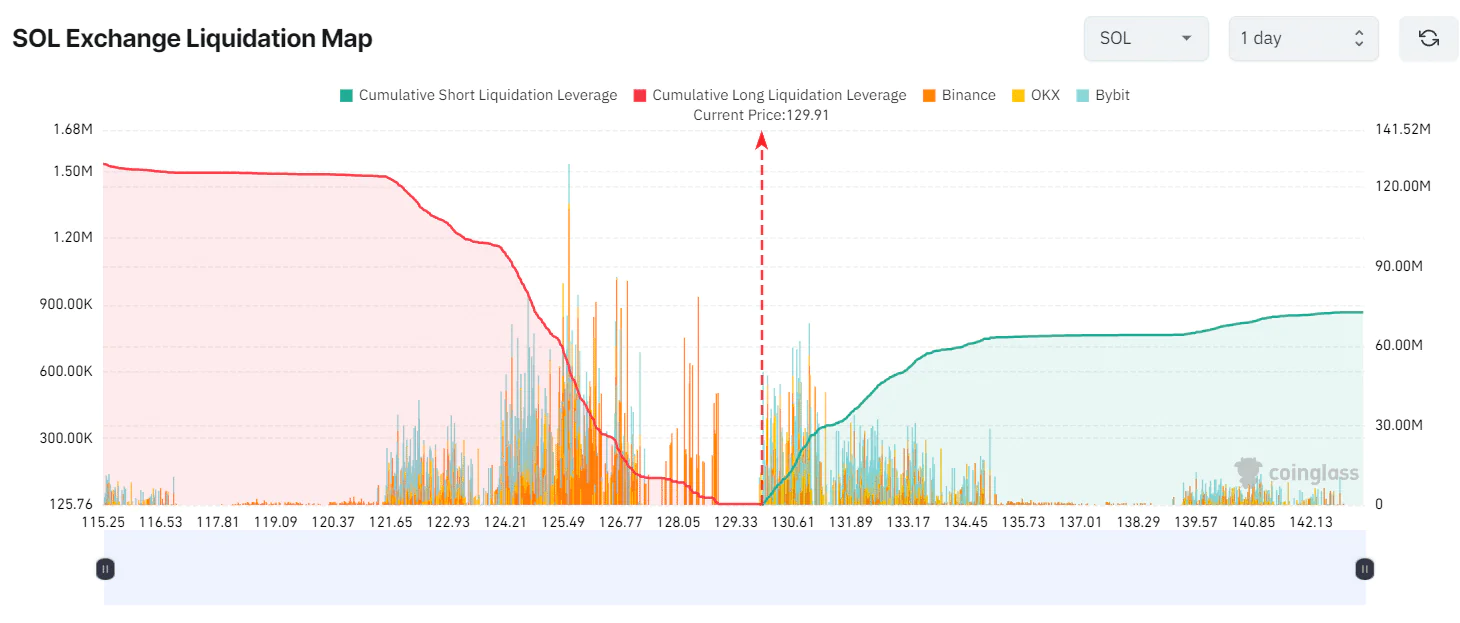
As of the latest report, key liquidation levels are near $125 on the lower end and $131 on the higher end, as traders appear to have over-leveraged at these levels, according to CoinGlass data. Should the optimistic sentiment among traders falter and SOL’s price drops to $125.61, nearly $56 million worth of long positions could be liquidated.

On the other hand, if the optimistic sentiment prevails and the price reaches $131, approximately $25 million worth of short positions would be liquidated.
Based on this data, it appears that buyers currently hold the upper hand, with a high potential for liquidating short positions.
At the time of reporting, SOL is trading near $130.40, reflecting a price increase of more than 2.5% in the past 24 hours. However, its trading volume has dropped by 65% during the same period, suggesting lower trader participation following recent price declines.


