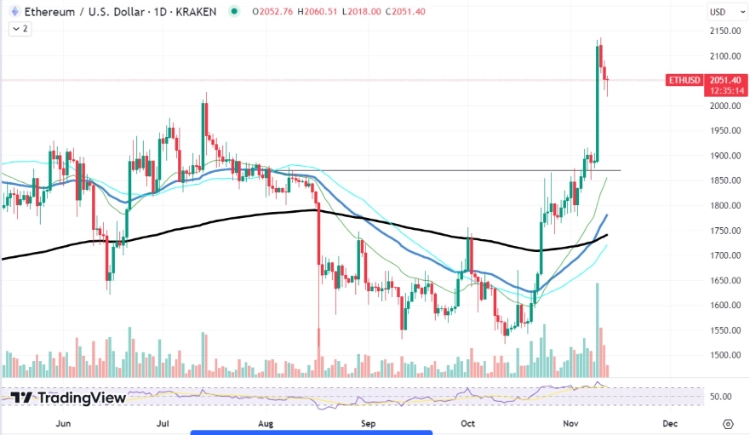
Ethereum’s (ETH) recent surge in price has temporarily paused, prompting speculation among investors about when the upward momentum might resume. Examining the chart and recent developments provides insights into potential future scenarios. The Ethereum chart reveals a recent pullback following a sharp price increase, indicating a period of consolidation for the market.
This phase is considered healthy as it allows the market to establish new support levels. Despite the pause, Ethereum’s price remains comfortably above its 50-day and 100-day moving averages, suggesting an overall bullish trend. The relative strength index (RSI) has retreated from overbought levels, potentially creating room for another price increase.
In a bullish scenario, if Ethereum maintains its support levels and avoids dropping below the moving averages, it could gear up for another rally. Factors such as increased adoption and positive market sentiment may fuel this potential uptrend. Investors are advised to monitor the Bollinger Bands for a narrowing pattern, followed by a breakout above the upper band, signaling the beginning of a bullish phase.
Conversely, a break below the moving averages could indicate a bearish reversal. Increased selling pressure and negative market sentiment might drive the price down. Confirmation of a potential downtrend could come from a bearish crossover on the MACD.
Related: BlackRock Introduces Ethereum Trust ETF on Nasdaq, Price Surpasses Key Level
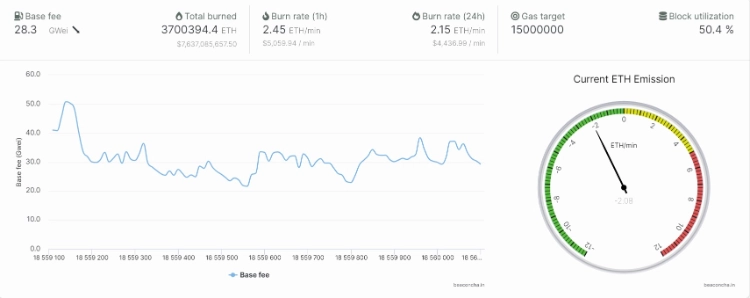
Recent data suggests that Ethereum’s burn rate has shown steady growth, outpacing emissions post the Merge upgrade. However, the daily burn rate hit a seven-month low on March 12, showcasing an over 89% drop since its record highs. This dynamic in burn rate could influence supply and demand economics, potentially impacting the price.
Investors should closely observe the continuation of the net burn trend, which, if sustained, could lead to decreased supply and higher prices if demand remains stable or increases.
In the realm of meme coins, Shiba Inu (SHIB) has captured attention with its recent price movements, sparking discussions about breaching the $0.00001 threshold. Noteworthy transfers by Binance add to the speculation, warranting a technical analysis of SHIB’s potential.
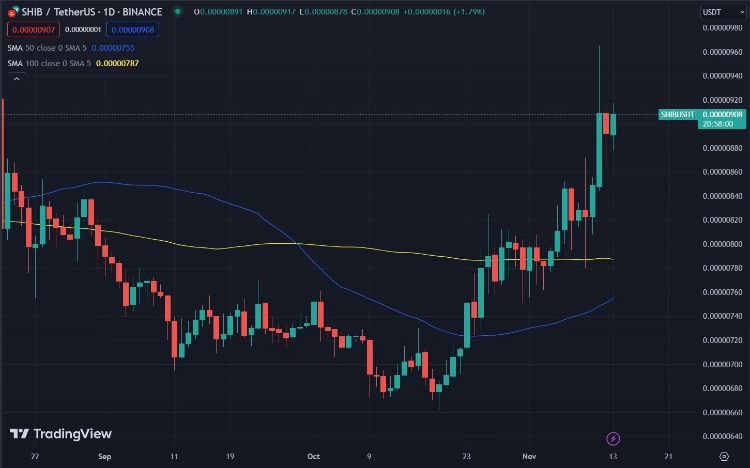
Analyzing the SHIB price chart reveals a significant increase in value, challenging previous resistance levels. The MACD shows a positive trend, with the RSI trending upward, potentially indicating increasing buying pressure. Breaking the 50-day and 100-day moving averages suggests a robust uptrend, supported by volume bars correlating with the price increase.
The expansion of Bollinger Bands indicates heightened market volatility and potential for substantial price movements. The $0.00001 mark is within sight for Shiba Inu, and a sustained move above this level would require maintaining current momentum and a continued influx of buying volume.
Recent large-scale SHIB transfers by Binance could signal institutional interest or significant traders taking positions, potentially leading to dramatic price movements. While the technical setup for SHIB appears promising, investors should exercise caution due to the inherent volatility of meme coins and sensitivity to market sentiment.
Monitoring technical indicators and news surrounding large transfers will be crucial in assessing whether SHIB can sustain its upward trajectory.

