SUI [SUI] found itself entangled below a resistant threshold near the $1 mark throughout late December and early January. However, in the recent four days of trading, bullish momentum obliterated this resistance.
A comprehensive analysis of the token’s technical aspects revealed a distinctly bullish bias on higher timeframes. Despite this, the substantial gains witnessed in the past few days raise concerns about a potential significant retracement.
Spot market demand has been lackluster in recent days, creating an opening for sellers and profit-takers to guide prices towards the $1 support level. While Fibonacci levels provide limited insight into SUI’s price action, the current scenario indicates a challenging landscape.
Limited Assistance from Fibonacci Levels in SUI Price Action
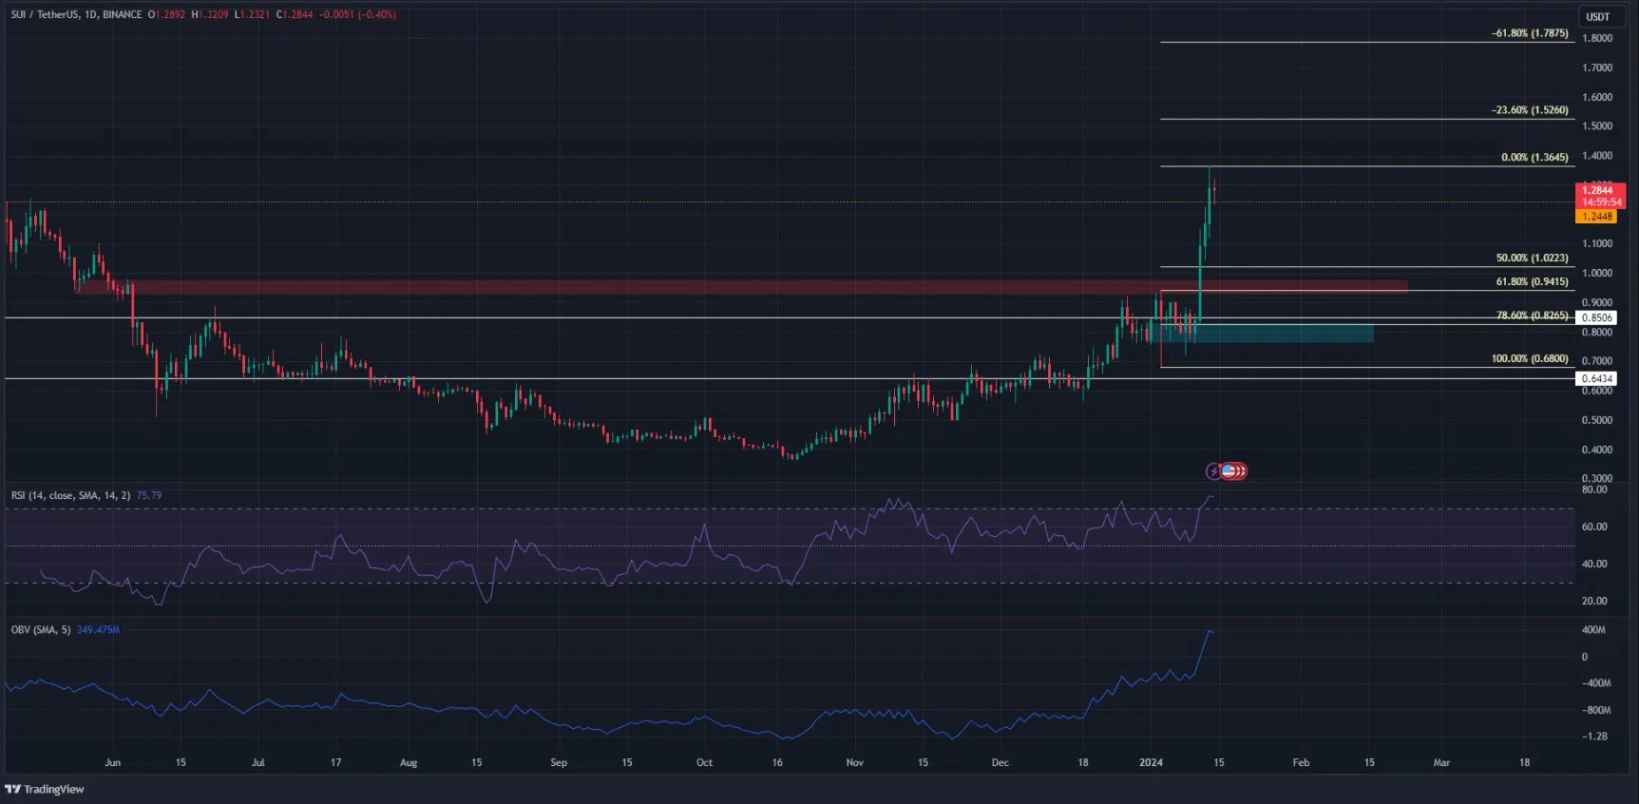
As of the latest update, SUI is priced at $1.2844, successfully surpassing the $1.245 resistance level dating back to May 2023, a noteworthy accomplishment visible on the one-day chart. The On-Balance Volume (OBV) reflects a robust uptrend over the past six weeks.
However, caution is warranted as the Relative Strength Index (RSI) sits at 75, signaling overbought conditions. Although this doesn’t necessarily imply an imminent retracement, it underscores the market’s overheated conditions, making a retracement a plausible scenario.
Examining Fibonacci levels, the $1.02 and $0.94 support levels emerge as crucial. Notably, the $0.94 level served as a former support zone in June 2023, later transforming into resistance a month ago.
However, safeguarding the crucial psychological level of $1 remains imperative for the bulls, potentially averting a retracement to $0.94.
SUI Demand Slows Down
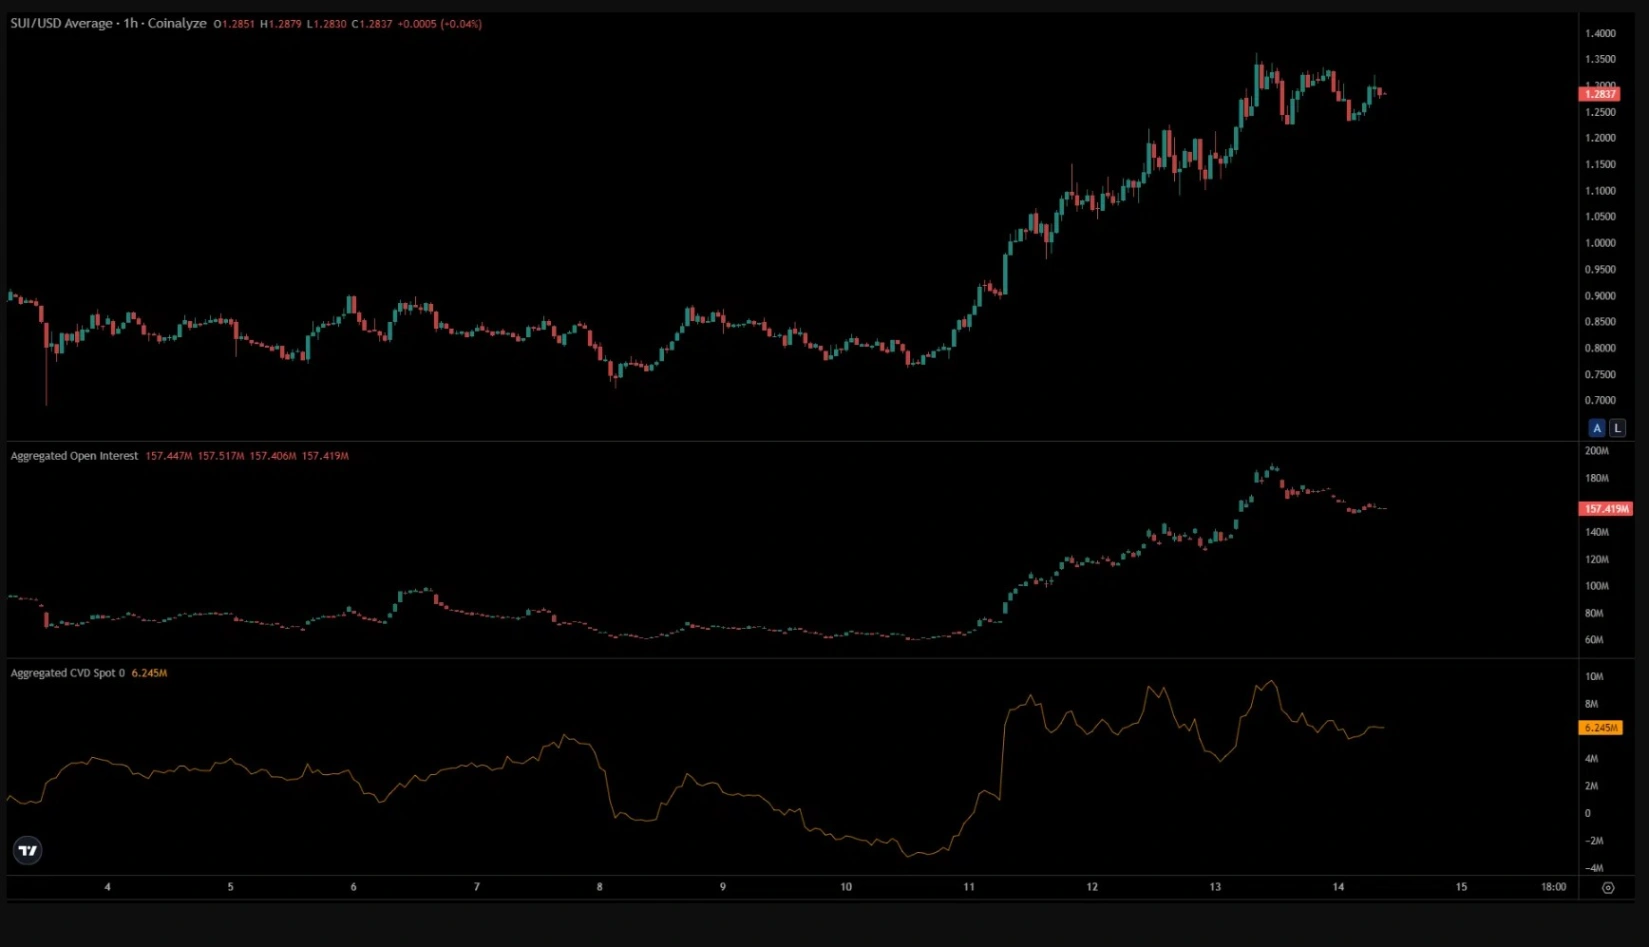
The deceleration in SUI demand is evident, as AZC News analysis of Coinalyze data reveals a weakly bearish market sentiment in the last 24 hours. Open Interest has dropped from $185 million on January 13 to $157.4 million just a day later.
Currently hovering in the $1.25-$1.3 range, the price trend indicates a cautious stance among futures traders. This stagnation suggests a collective anticipation for the next significant move before actively participating in the market.
An examination of the spot Cumulative Volume Delta (CVD) highlights a substantial upward movement on January 11, coinciding with prices surpassing the $1 mark. However, since then, the indicator has exhibited a sideways trend.
Related: One of the Largest Lending Protocols Expands to Sui
The equilibrium between buyers and sellers, as indicated by the spot CVD, implies a likelihood of increased volatility. Any further decline in demand could potentially shift the balance in favor of sellers.


