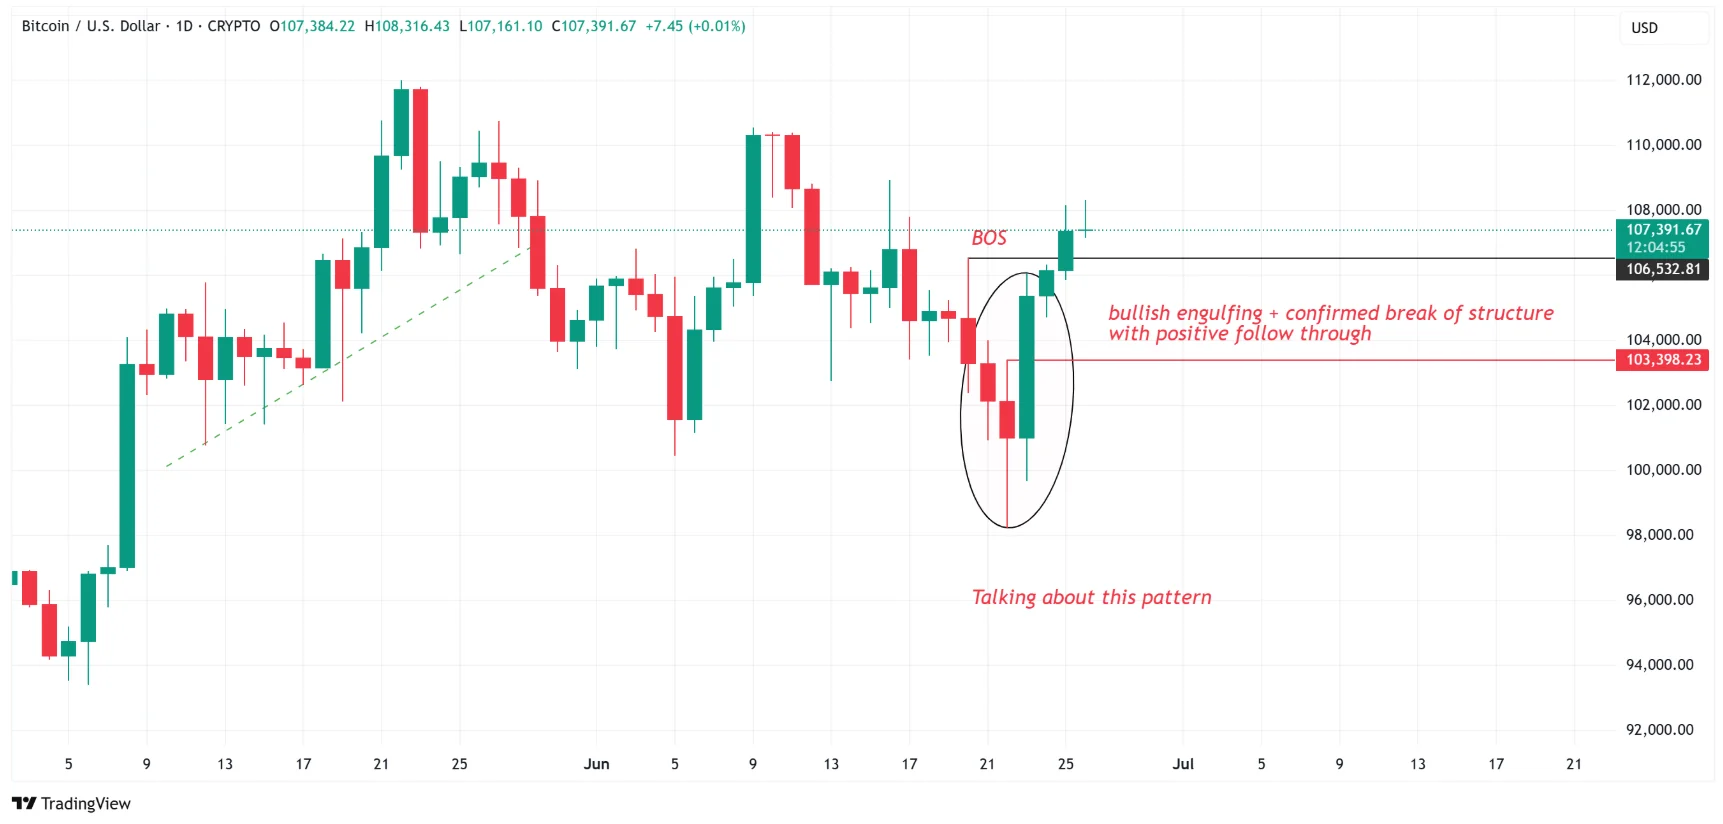
A highly accurate technical pattern has just appeared on Bitcoin’s (BTC) daily chart, sparking renewed hopes of a potential new price peak in the near future.
On Monday, BTC surged 4.34%, forming a bullish engulfing candlestick — a large green candle that completely covers the previous two red candles. This formation, combined with Bitcoin holding firm above the $105,000 support level for two consecutive days, signals a potential trend reversal and strengthens the ongoing recovery.
Despite the optimistic technical signals, market sentiment remains divided, prompting analysts to remain cautious. To assess the reliability of this signal, AZC News analyzed all bullish engulfing patterns that have appeared on Bitcoin’s daily chart since 2021.

In addition to identifying the candlestick formation, researchers applied three strict confirmation criteria:
- The bullish candle must engulf at least two preceding candles.
- The pattern must appear after a clear corrective phase.
- A clear structure breakout should follow in subsequent sessions to confirm the upward trend.
Since January 2021, there have been 19 instances of bullish engulfing patterns that met all these conditions. Of those, 15 resulted in a new local high within days or weeks — translating to a historical success rate of around 78%.
Notably, all of these successful signals occurred during broader uptrends. The only two failures — in May 2024 and March 2025 — did not lead to new highs following the pattern.
This underscores the importance of overall market direction: the engulfing pattern is most effective in bullish conditions. A stark contrast was observed in 2022 during a bear market, when four such patterns emerged — including three in February — but none led to higher highs.
Given the current market structure that favors buyers, along with strong technical indicators and improving sentiment, Bitcoin now appears well-positioned to reach a new high before potentially retesting the $100,000 level.


