Anticipating Solana’s Price Movement in December: A Potential Range of $50 to $60
The trajectory of Solana’s price action indicates a promising outlook, with bulls poised to surpass the $60 mark. However, the potential for a southward shift remains uncertain.
Solana, represented by the ticker symbol SOL, exhibits a robust bullish trend on the price chart. The recent revelation of the USD Coin (USDC) monthly transfer volume exceeding $70 billion has only bolstered the positive sentiment surrounding this blockchain platform.
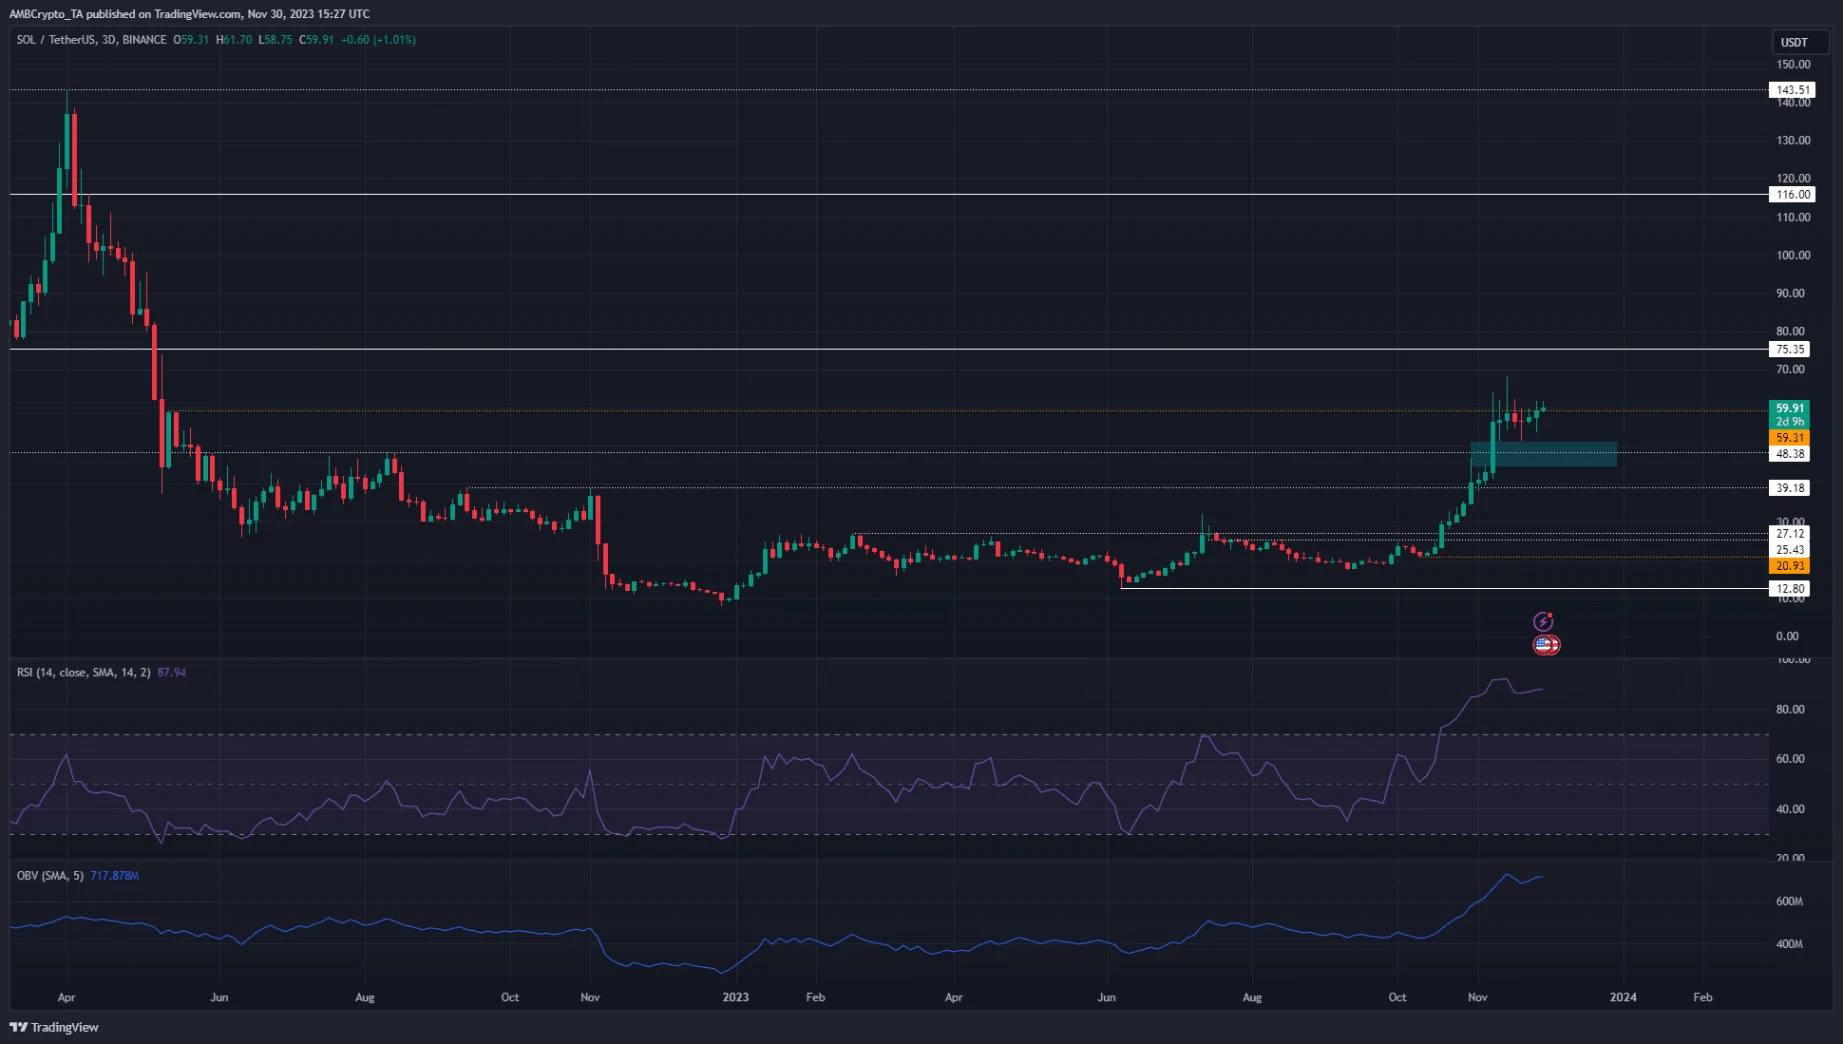
After a year-long period of trading within the $10-$26 range, Solana successfully broke out, achieving remarkable gains for a large-cap asset. Between October 20th and November 16th, SOL experienced a noteworthy surge of 148%, soaring from $27.5 to a peak of $68.2. Despite this impressive run, the momentum might experience a temporary pause over the next month or two.
Analyzing the three-day chart reveals a robust bullish market structure and momentum, with the Relative Strength Index (RSI) registering at 87. However, no significant pullback is imminent at this stage. Additionally, the On-Balance Volume continues its upward trajectory, indicating sustained high buying volume and the potential for further gains.
It is worth noting that there exists a substantial liquidity pocket at the $50 mark. While not every liquidity pocket necessitates revisiting, Solana has demonstrated resilience over the past six weeks, suggesting the possibility of navigating this specific pocket without a retracement. As we navigate December, the cryptocurrency community eagerly watches for how Solana will navigate this intricate balance between bullish momentum and potential southward pressure.
Related: Cardano Finds Support in Critical Zone, Potential Rally to $0.46
Navigating Potential Market Pivots for Solana: Brace for $62-$68 Range Volatility
Amid the market’s intricate dynamics, there’s a discernible possibility of a pivot within the $62-$68 range for Solana, presenting traders with the challenge of anticipating both a breakout and a rejection.
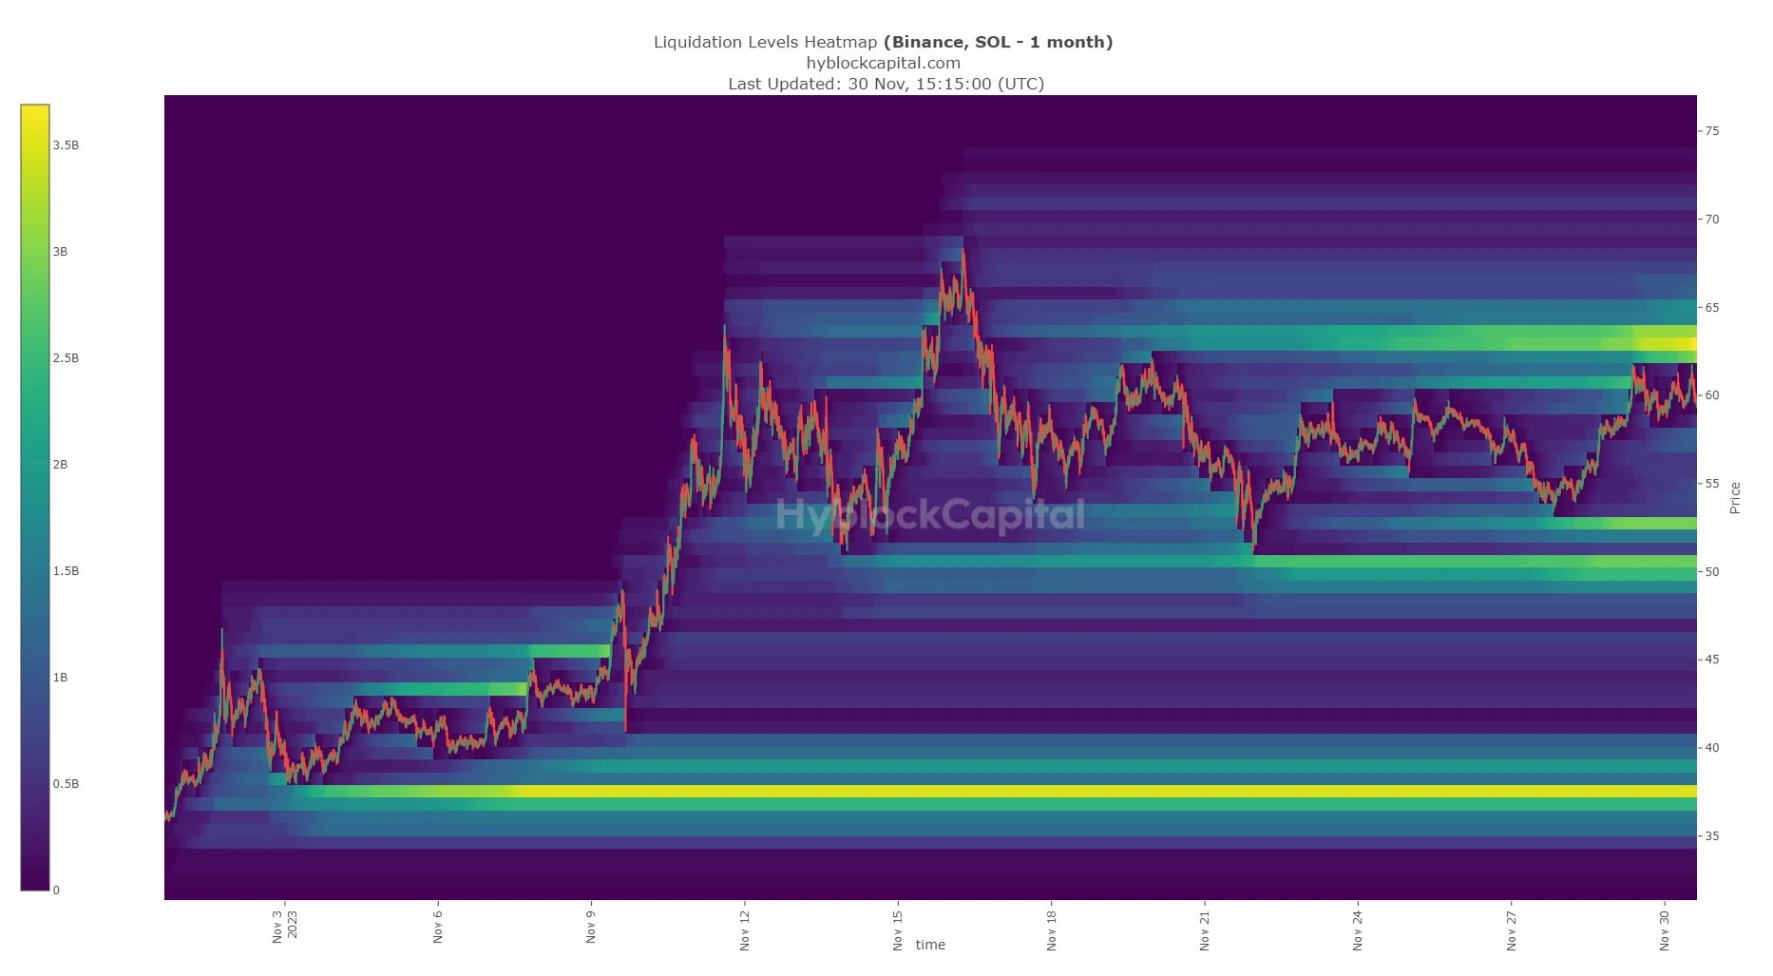
Despite the prevailing bullish sentiment, there exists a cautionary note regarding the potential southward pull driven by liquidity concerns. An examination of the liquidation levels heatmap from Hyblock reveals significant insights. The data from the past month suggests that a move towards the $62.5 region could trigger a substantial number of liquidations.
The dynamics of forced market buys resulting from short liquidations could propel SOL towards $70 before encountering a potential reversal. Conversely, towards the south, a considerable concentration of liquidations is observed at $50 and $52.75.
Therefore, the pivotal point lies in SOL’s ability to ascend beyond $68 and successfully transform the $60-$65 zone into a supportive range on the one-day or three-day chart. Failure to achieve this could pave the way for a retracement towards the $50-$52 range, outlining a plausible scenario in the coming market movements. Traders should remain vigilant and well-prepared for the potential shifts within this critical price range.


