SOL surged 5% to reach $160 earlier this week following the announcement of Solana’s first exchange-traded fund (ETF), set to launch on Wednesday. However, the rally was short-lived, with the altcoin erasing all gains within 24 hours, reflecting weak buying momentum and fragile market sentiment.
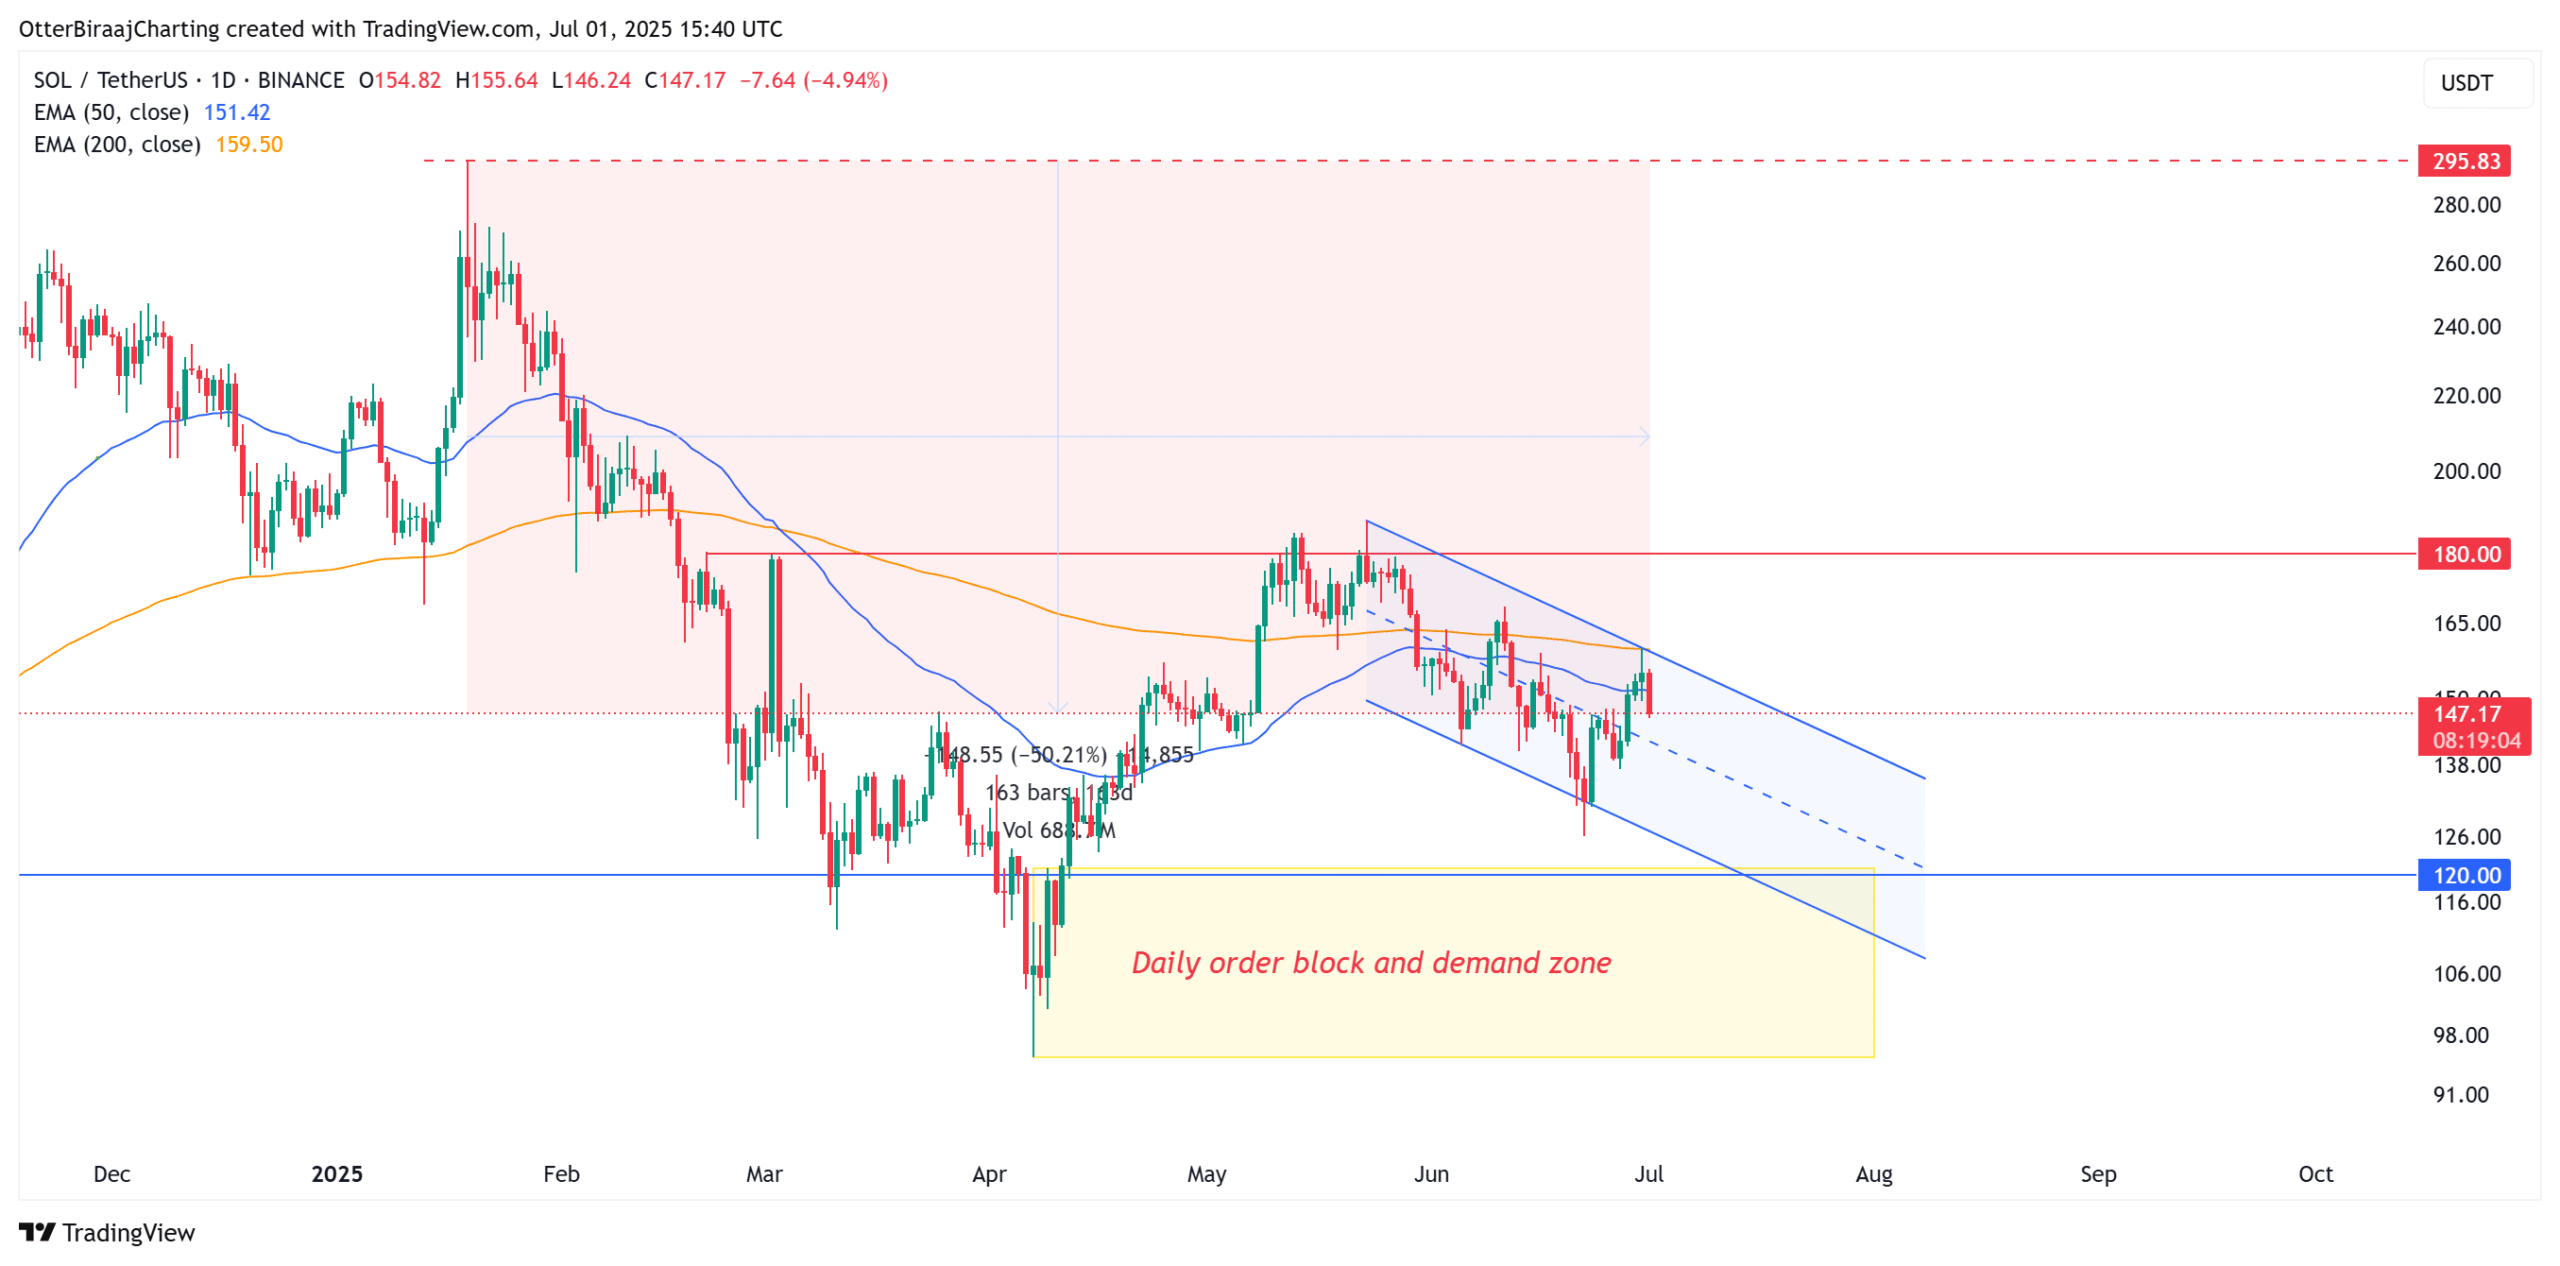
On lower timeframes, SOL has failed to stay above the 50-day and 200-day exponential moving averages (EMAs) for over a month. Although there have been a few bullish breakouts — such as last week’s move above $148 — none have resulted in a sustained uptrend.
Currently, the $148 level is under pressure, while $137 is emerging as a critical threshold. A drop below $137 would confirm a lower low, nullifying short-term bullish hopes. To regain momentum, SOL must hold the $137–$145 demand zone and climb back above $160.

On higher timeframes, the broader trend remains bearish. Since May, SOL has been unable to breach the key resistance at $180 and has been trending downward within a descending channel. Although such patterns can lead to bullish breakouts, SOL has shown strong correlation with Bitcoin’s weakness in recent weeks. While BTC is hovering near all-time highs, SOL has fallen nearly 50% since mid-January — a clear sign of underperformance.
If the downtrend continues, a drop toward the $120–$95 support zone is likely, offering a more attractive long-term buying opportunity. However, a strong daily close above $160 in the coming weeks could flip sentiment and trigger a bullish reversal across multiple timeframes.
Glassnode data shows that SOL is currently trading around $148 — right within a dense supply cluster, where 14.3% of tokens were acquired between $144.5 and $147.7. This zone is crucial: if buyers fail to defend it, the price could fall toward $124 or even the $100–$97 region, where thinner supply may cause increased volatility.
On the upside, resistance lies at $157, where 5.5% of the supply is concentrated — a key barrier that could limit any recovery in the short term.


