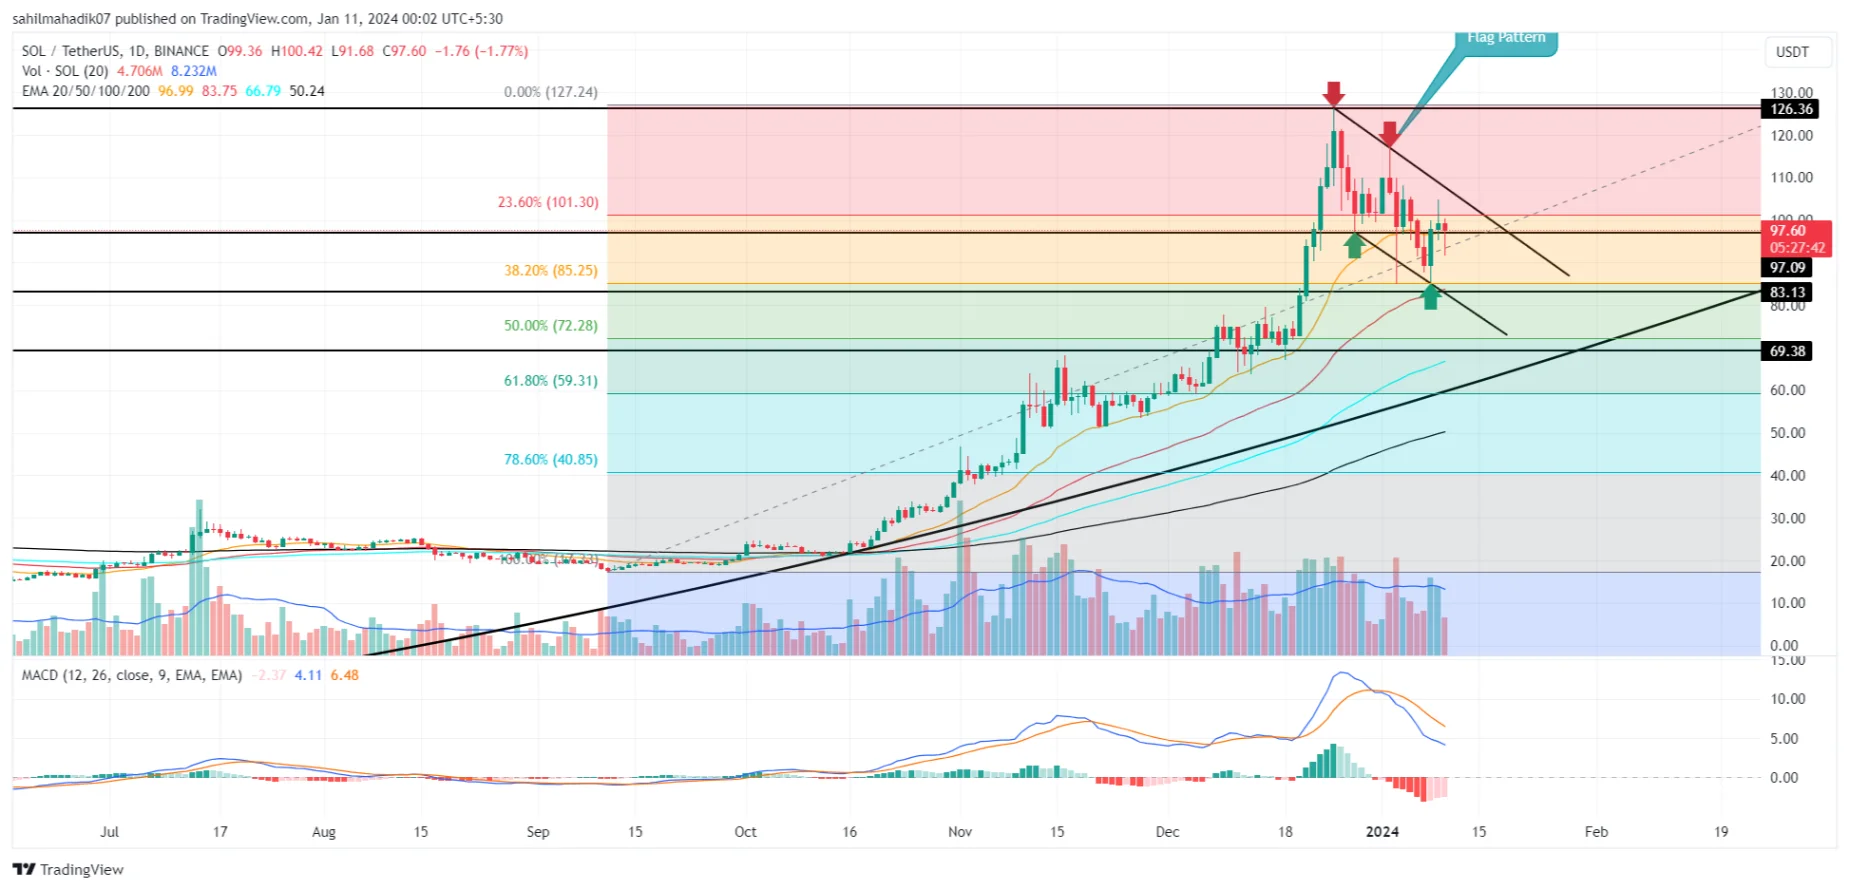
In the face of recent market volatility surrounding the potential approval of a spot Bitcoin ETF, Solana’s price has experienced a significant correction over the past two weeks. After reaching a new local high of $126.36, the coin has witnessed a sharp decline of nearly 25%, currently trading at $94.58. However, a closer look at the daily chart reveals the formation of a bullish Flag pattern, suggesting that the asset may soon rebound and aim for higher price targets.
The retracement to the 38.2% Fibonacci level indicates that the overall trend for Solana remains bullish. If the price successfully breaks out of the flag pattern in a bullish manner, it would suggest that the correction phase is coming to an end.
With a 24-hour trading volume of $3.3 billion, Solana has seen a 12% gain, indicating growing investor interest. The recent pullback from the all-time high of $126 in late December found support at the 38.2% Fibonacci retracement level of $85.
Despite the temporary decline, the daily time frame reveals a pattern of lower highs and lower lows, which has now formed a bullish reversal pattern known as a Flag. This suggests that the current retracement is likely a temporary pullback, allowing for a replenishment of bullish momentum before the next upward move.
As the market awaits news regarding the spot Bitcoin ETF, Solana’s price action and the emergence of the bullish Flag pattern provide potential indications of a future recovery and upward movement in the near term.
The potential approval of spot Bitcoin ETFs this week could have a significant impact on the altcoin market, including Solana (SOL), as it receives a surge of investor interest alongside the rising BTC price. This favorable scenario may lead to the SOL price breaking through the overhead resistance trendline of the flag pattern, providing buyers with a solid foundation to resume the recovery trend.
Based on the Fibonacci extension, a spot-breakout rally has the potential to propel SOL by 58%, reaching a target price of $152.
Related: ETF Prediction Drives Bitcoin Surge, Boosts Ethereum, XRP, Solana
SOL vs BTC Performance
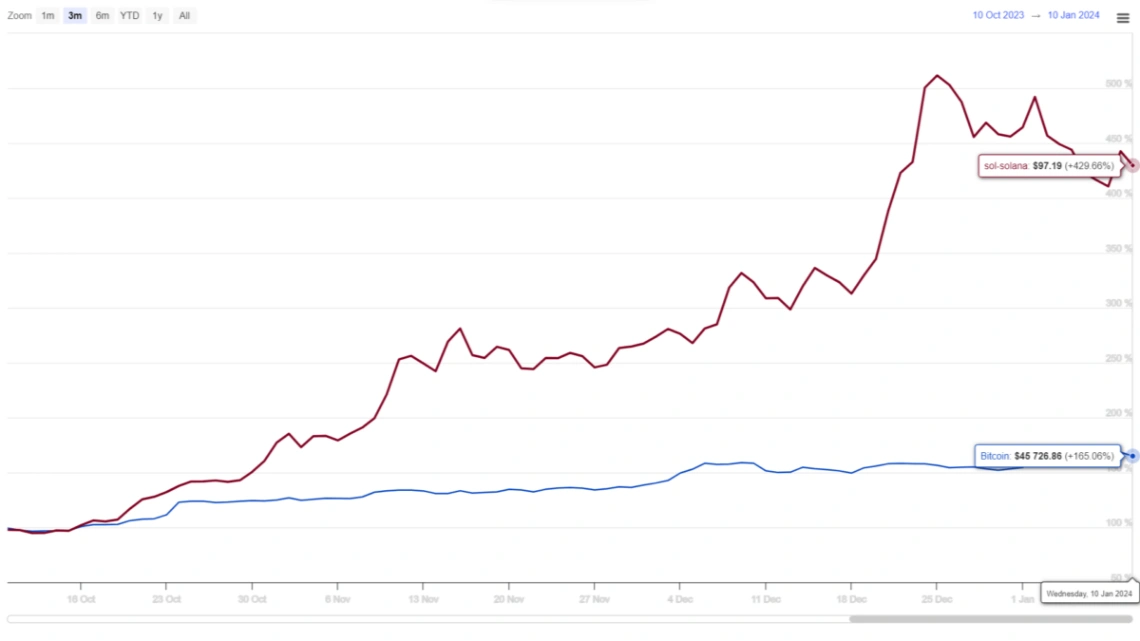
Comparing the performance of SOL and BTC over the past three months, both have exhibited bullish trends. However, a notable difference lies in their recovery patterns. Solana (SOL) has experienced more robust recoveries, characterized by significant retracements that offer favorable opportunities for pullback trading strategies. In contrast, Bitcoin has demonstrated a steadier and more gradual upward trend, making it better suited for breakout trading strategies.
Technical indicators such as the 50-day Exponential Moving Average (EMA) suggest that the EMA could continue to provide support for buyers during pullbacks.
Regarding the Moving Average Convergence Divergence (MACD), the current bearish crossover between the MACD and signal line indicates that there is no immediate indication of a price reversal in SOL.
In summary, the potential approval of spot Bitcoin ETFs could bring significant opportunities for the altcoin market, including SOL. If the approval occurs, SOL’s price may surge and surpass the resistance trendline, potentially reaching a target price of $152. Traders can consider pullback strategies supported by the 50-day EMA, while monitoring the MACD for any signs of a trend reversal.


