According to analysis by Michaël van de Poppe, Polkadot’s growth over the recent 24 hours could be a sign of a potential bull run that would take the price to an all-time high.
In his analysis, van de Poppe compared DOT’s performance with Tether (USDT) and Bitcoin (BTC). He emphasized that DOT has produced higher highs and lows compared to USDT.
DOT is in an uptrend
Having higher highs and lower lows is seen as a sign of price growth, indicating that the asset can resist the downward trend and achieve higher value. According to the chart van de Poppe shared, DOT has started an uptrend from $8.97. However, it is facing key resistance around $10.
#Polkadot is starting to gain positive momentum, as it's making higher highs and lower lows on the USDT pair.
The BTC pair is still at the cycle low, indicating a likely upward run on the horizon.
Perhaps $DOT can run towards an all-time high in the coming months. pic.twitter.com/dewBRJO9dO
— Michaël van de Poppe (@CryptoMichNL) March 17, 2024
If DOT can close above this resistance, it could signal a rally to $17. Furthermore, if DOT breaks above $17, a breakout could occur that could push the price to an all-time high.
In terms of performance relative to Bitcoin, the analysis shows that DOT is at a cycle low, which could support the view of the token’s long-term upside potential.
Related: Which is Better Cosmos or Polkadot?
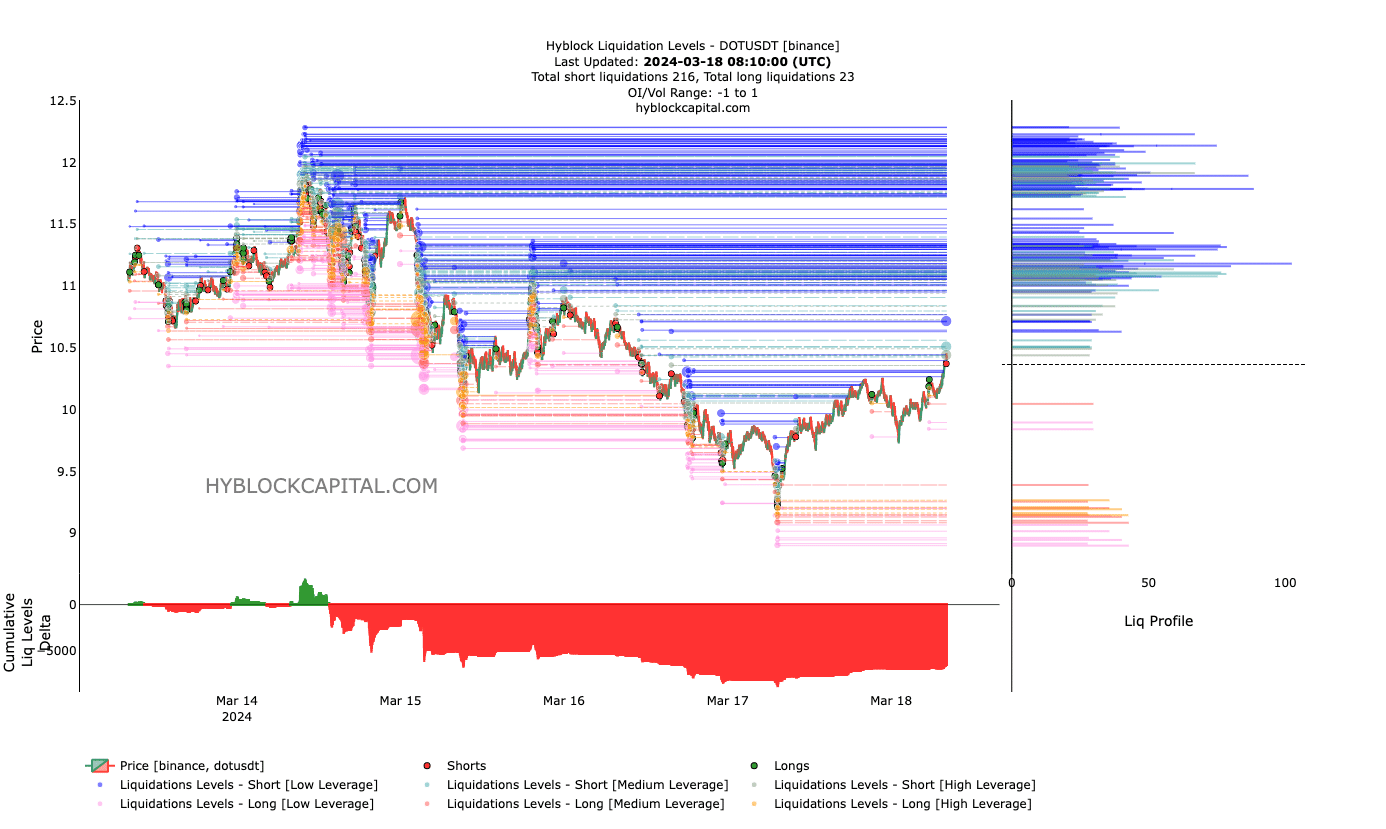
However, it is important to evaluate DOT from many different perspectives. One of them is the liquidation level available on the HyblockCapital platform, which is an important indicator to evaluate the estimated price level where the liquidation event may occur.
At the same time, it is also important to pay attention to the Cumulative Liquidation Level Delta (CLLD). CLLD provides information on whether the derivatives market is driving an upward or downward trend.
Source: HyblockCapital
The situation is not very positive for short selling funds
There is currently no liquidity pool in the range between $10.36 and $10.96. So, a rise in DOT to $11 could easily happen. However, at this price level, more liquidation is possible, especially with highly leveraged traders.
As for CCLD, we infer that medium to high leveraged short positions may be closed. This is because CLLD has fallen into the negative region. This negative result shows that sellers are trying to catch up with the downtrend as DOT price falls slightly. However, long-term liquidation levels are also affected by the rapid recovery.
Source: Santiment
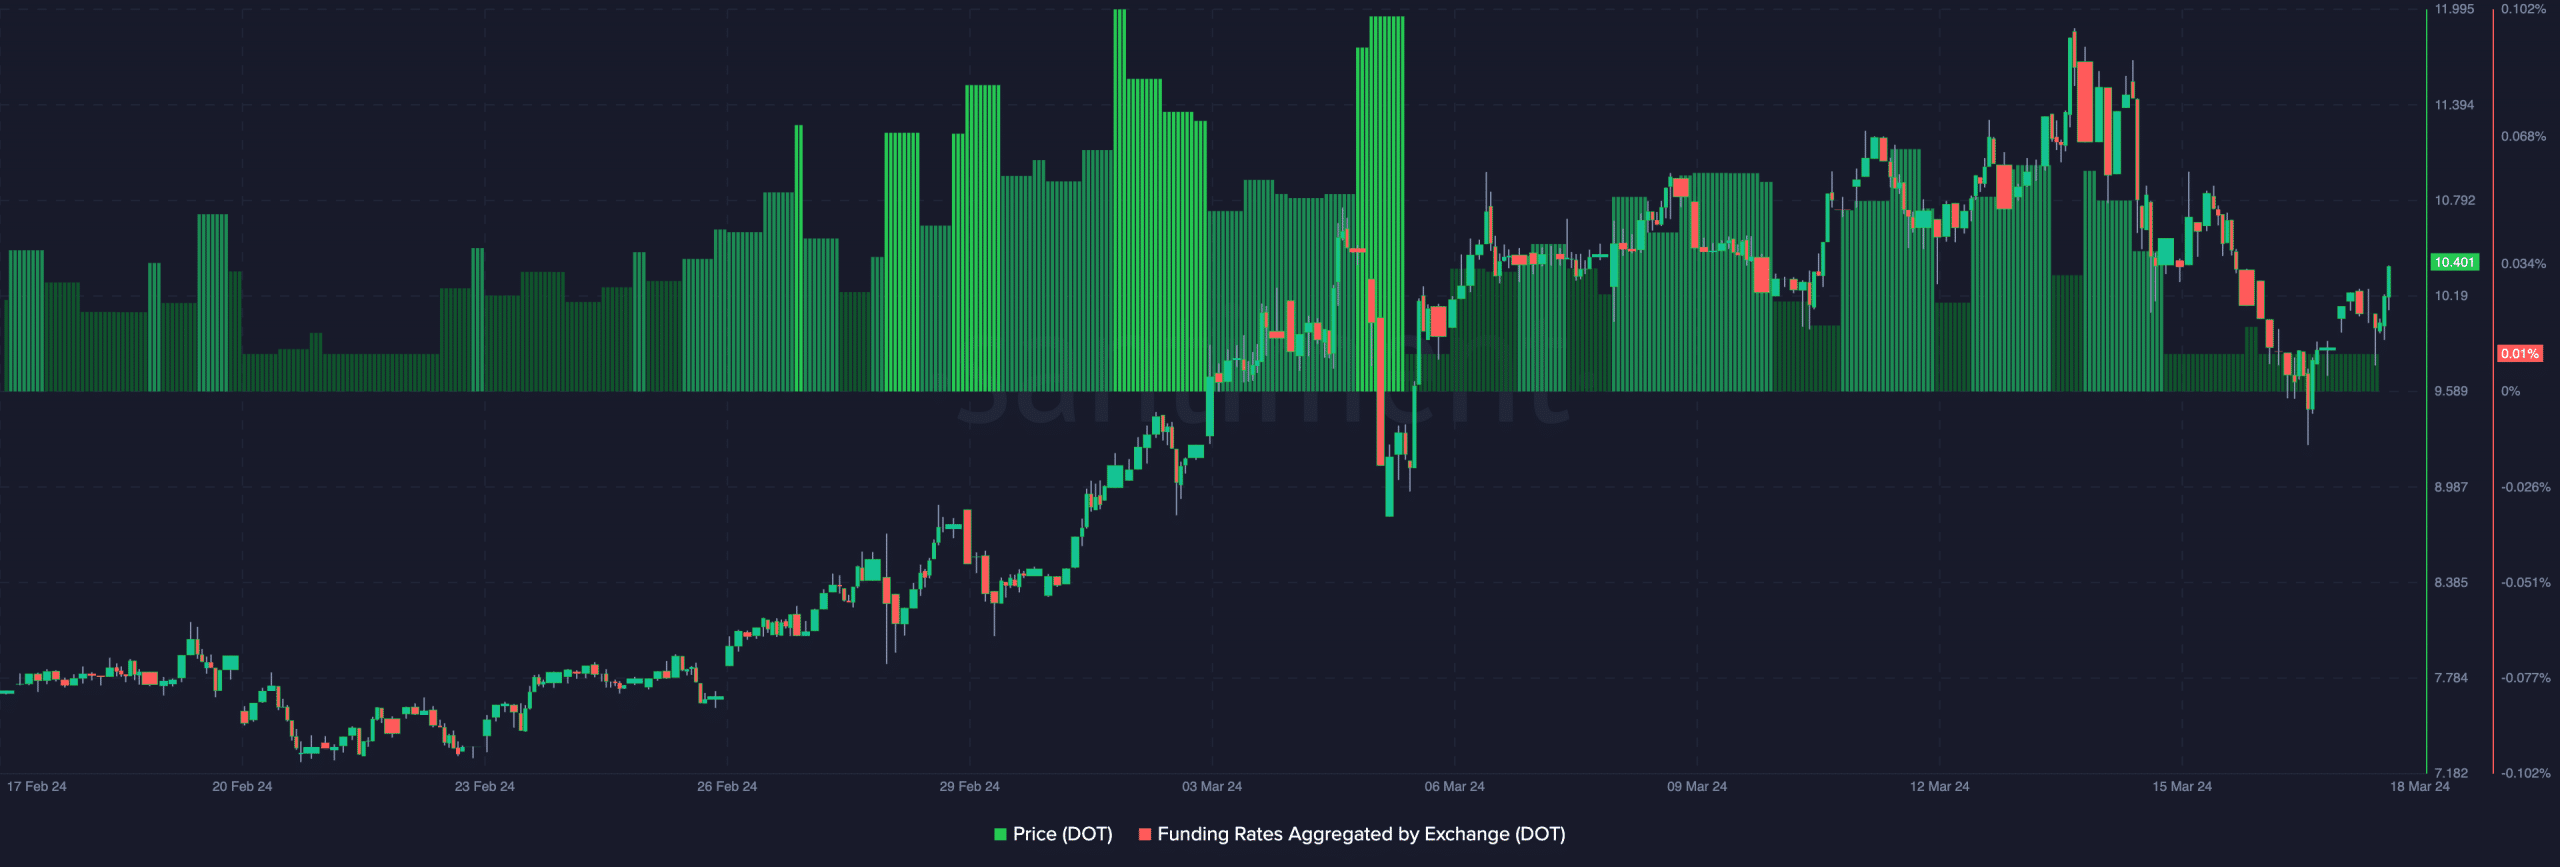
So, this supports the bullish view of the token. Additionally, the funding ratio is positive, showing that long positions are paying for holding their positions.
For those unfamiliar, funding is the difference between the spot price and the fixed price. One thing is that funding rates are decreasing as DOT prices increase. This shows that spot buyers are accumulating strongly, while fixed sellers are skeptical. As for the price of the token, this is a bullish sign.
As a result, DOT’s northbound operations may continue in the coming weeks.


