Technical Breakout Sets Stage for Further Gains
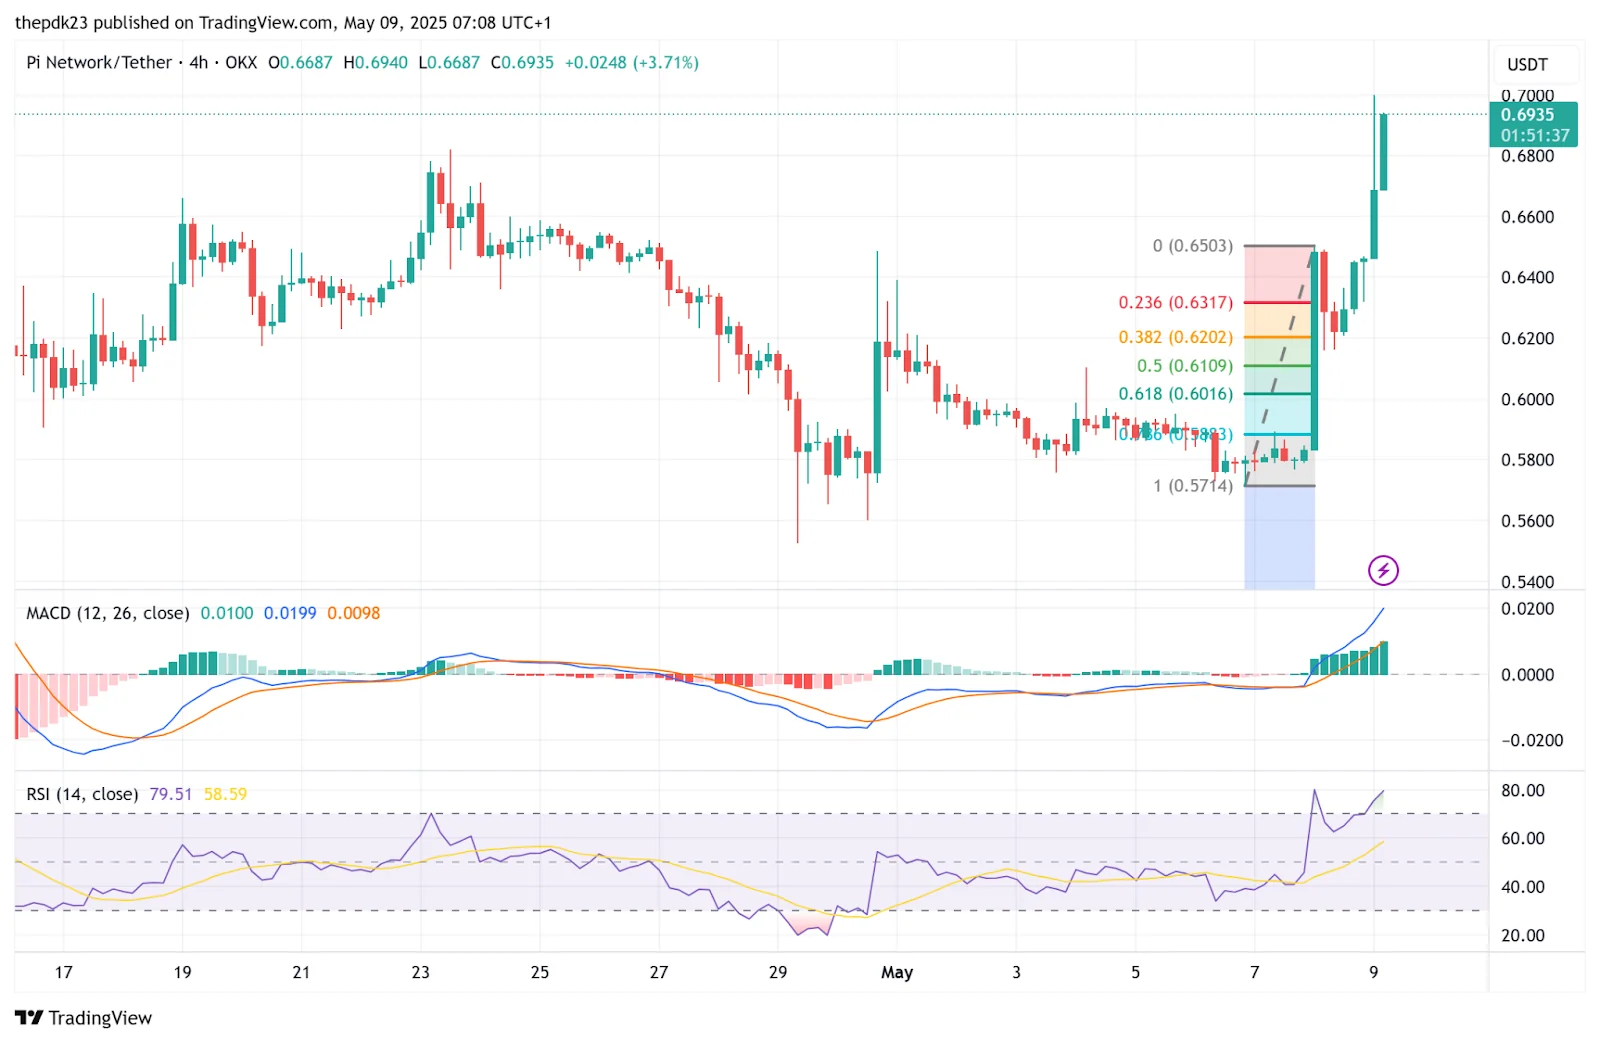
From a technical perspective, PI has broken above its 20-day Exponential Moving Average (EMA) at $0.6291. More notably, it surpassed the key resistance zone between $0.66 and $0.67 with strong volume, indicating robust buying momentum. If PI holds this breakout, the next price target could be in the $0.85–$1.00 range.

A sudden spike in PI’s circulating supply caught the market’s attention when it briefly jumped by 5 billion tokens (from 7 billion to 12 billion) before quickly returning to normal. According to analyst Dr. Altcoin, this change didn’t affect the supply on exchanges, suggesting it may have been a liquidity test for a newly formed 5-billion-token pool.
This move is seen as a likely precursor to potential listings on top exchanges. Binance, BitMart, and HTX have been mentioned by the community as possible candidates.
Price Outlook: Holding $1 Before a Push to $2?

Dr. Altcoin predicts that PI may stabilize around $1 until approximately May 14. If positive listing news emerges, the token could climb toward the $2 mark by the end of August.
On the 4-hour chart, the Relative Strength Index (RSI) currently sits at 78.92—above the overbought threshold of 70—suggesting potential for short-term consolidation or a price pullback. However, the MACD remains bullish: the MACD line (blue) is above the signal line (orange), and both are above zero, with growing green histogram bars supporting a strengthening uptrend.
Structurally, PI is trading well above its recent swing high (0% Fibonacci level). If a pullback occurs, the first support zone is near $0.6317 (Fibonacci 0.236, aligned with the 20-day EMA).
Deeper support levels are located at $0.6202 (Fibonacci 0.382) and $0.6109 (Fibonacci 0.5). A drop below $0.6016 (Fibonacci 0.618) could signal a broader correction for PI.


