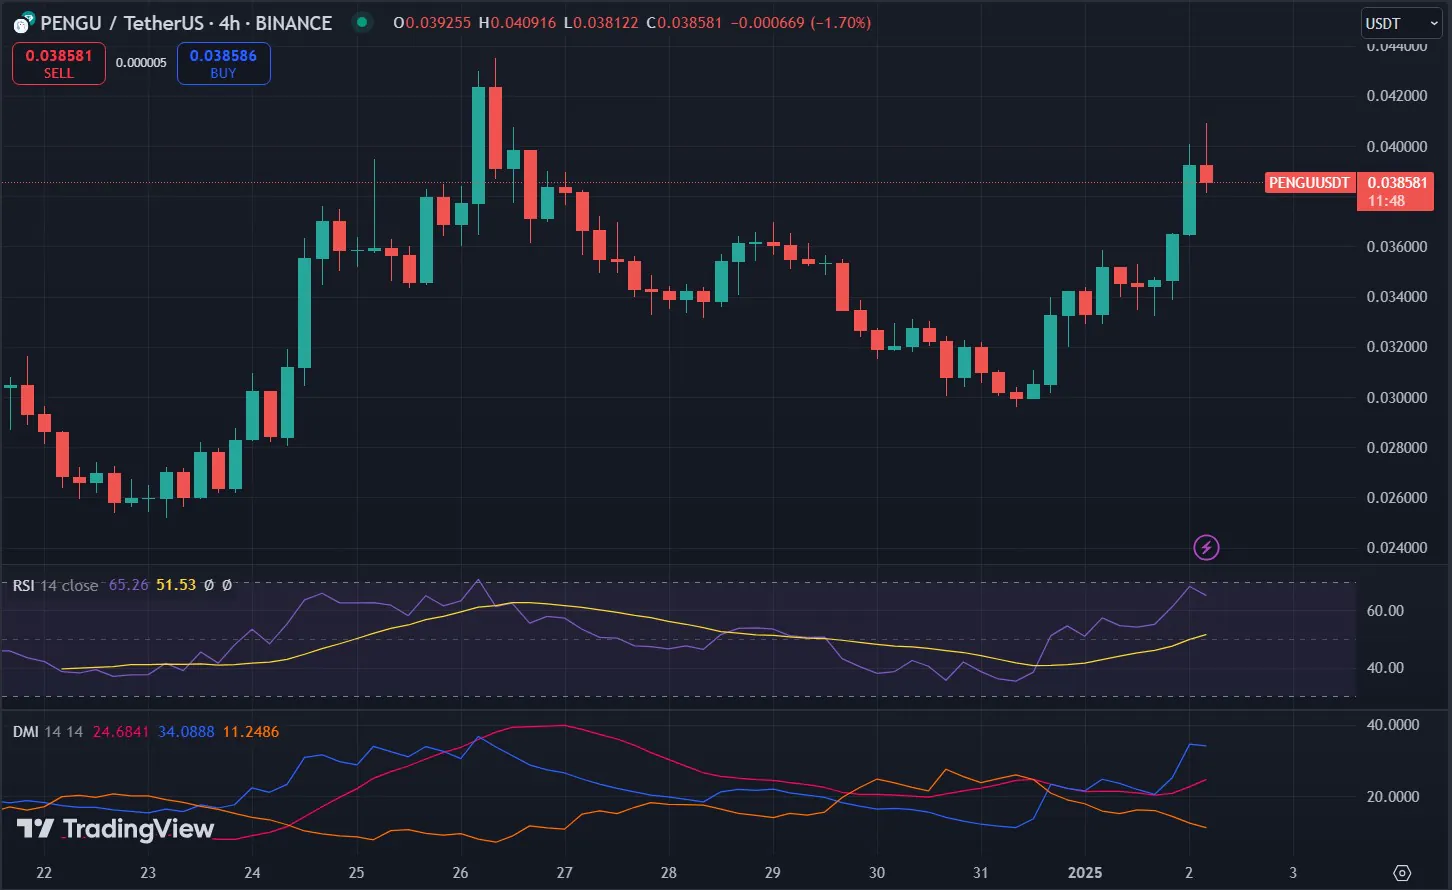
Pudgy Penguins (PENGU) price has increased by more than 25% in the past 2 days, while trading volume has increased by 150%. Currently, PENGU is the second largest meme coin on the Solana platform, behind only BONK, and has attracted a lot of attention as its market cap has increased to $2 billion.
Despite the recent strong RSI and bullish momentum reflected in the DMI, the trend strength remains modest, indicating cautious optimism from traders. The altcoin is approaching a key resistance level at $0.043, with the potential for further gains or losses depending on whether the current momentum is maintained or reversed.
PENGU RSI is rising sharply but still in neutral territory
PENGU’s Relative Strength Index (RSI) is currently at 51, down slightly from 57 yesterday, after rising from 35 in less than a day. This shows that buying pressure has eased slightly, but the RSI remains in neutral territory.

The rapid rise from the previous oversold level suggests a recent recovery, but the stabilization around 51 reflects the market pausing to assess the next direction of PENGU’s price.
RSI is a momentum indicator that measures the strength and speed of price movements on a scale of 0 to 100. Readings above 70 indicate overbought conditions, usually signaling a potential downside correction, while readings below 30 signal oversold conditions and a potential price recovery.
With PENGU’s RSI at 51, the indicator does not show strong bullish or bearish momentum, reflecting the market’s indecision. In the short term, the neutral RSI suggests that PENGU’s price may consolidate, unless there is a significant change in buying or selling pressure to push the momentum more clearly.
PENGU Trend Lacks Strength
PENGU’s DMI chart shows that the ADX is currently at 20.3, down slightly from 25 a day ago, indicating that the trend strength is weakening. This decline in ADX suggests that despite recent momentum, the market is now entering a phase of declining directional strength.
With the +DI (Directional Indicator) at 20.7 and the -DI at 16.1, the chart reflects a slight bullish bias. Buying pressure is still stronger than selling pressure, but the intensity is still quite modest.
The ADX (Average Directional Index) measures the strength of a trend on a scale of 0 to 100, regardless of the direction of the trend. Values above 25 indicate a strong trend, while values below 20, such as PENGU’s current 20.3, indicate a weak or unclear trend. A +DI slightly above -DI suggests that bullish momentum remains, but a falling ADX suggests a lack of significant strength in the trend.
In the short term, PENGU prices may see limited movement unless the ADX rebounds to confirm a stronger trend or the directional indicators show a clear change in buying or selling pressure.


