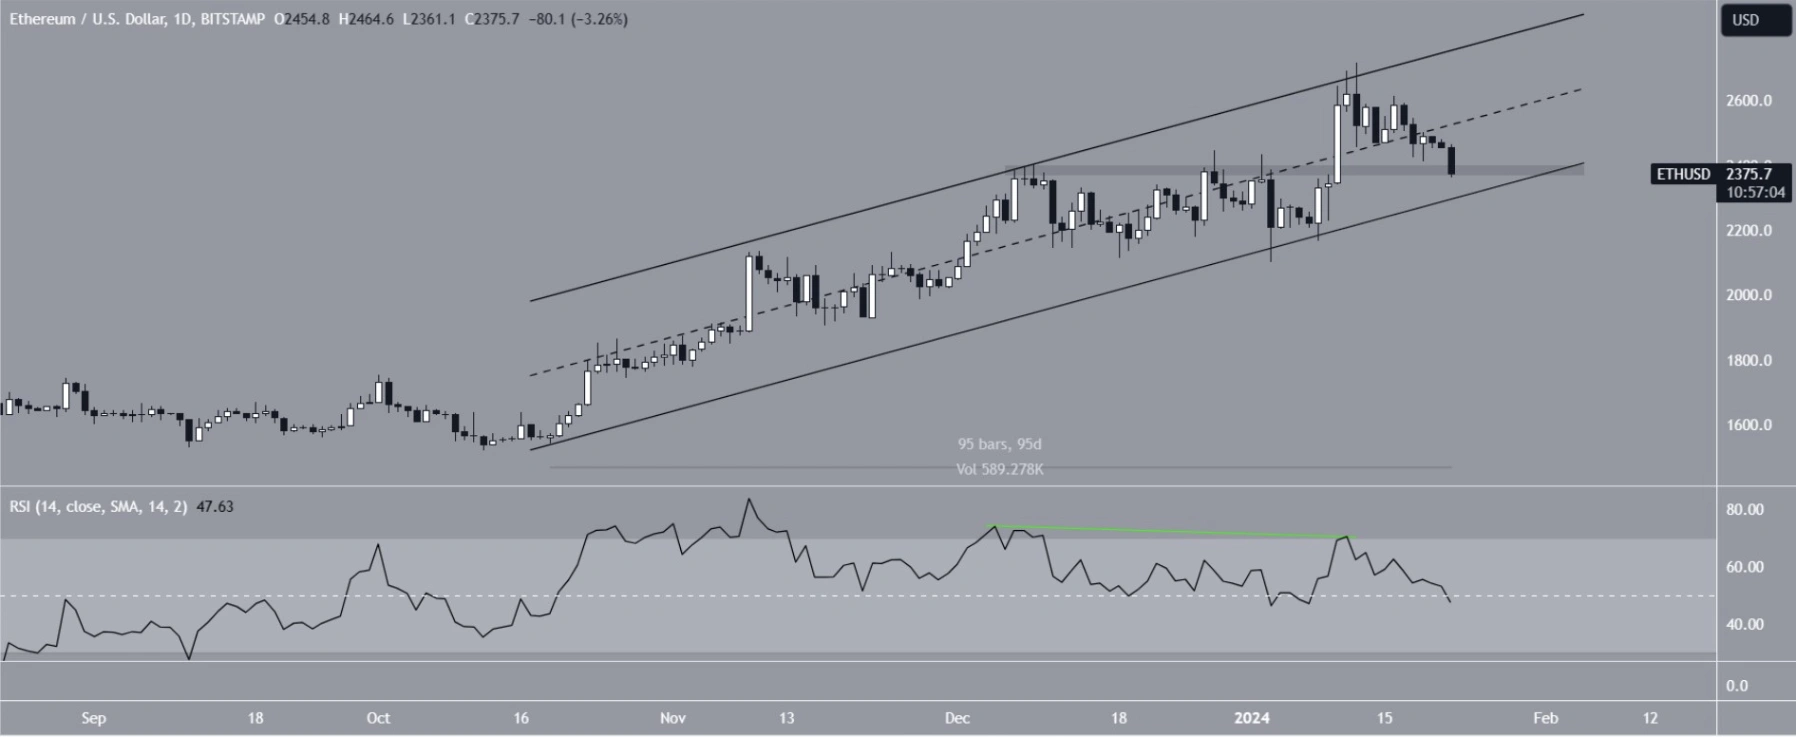
The Ethereum (ETH) price is currently positioned within a crucial horizontal zone that previously served as resistance.
Confluence of Short-Term Support
Notably, ETH is trading amidst a convergence of short-term support levels, adding significance to its role in shaping the forthcoming trend.
Examining the daily time frame’s technical analysis reveals that ETH has been traversing within an ascending parallel channel over the last 95 days. Following a peak at $2,717 on January 12, validating the channel’s resistance trend line (depicted in red), Ethereum has experienced a subsequent decline.
At present, the cryptocurrency hovers near the support trend line of the established channel. Simultaneously, it is situated within a pivotal horizontal area that once posed as resistance, now potentially acting as support upon a bounce.
The daily Relative Strength Index (RSI) signals a bearish outlook. As a momentum indicator, the RSI helps traders gauge market conditions. An RSI above 50 during an upward trend favors bulls, while an RSI below 50 suggests a bearish trend.
In this case, the RSI displayed a bearish divergence (highlighted in green) prior to the downturn and is currently below 50 (indicated in red), reinforcing the indications of a bearish market trend. Traders will closely monitor these dynamics to make informed decisions regarding asset accumulation or selling.
Expert Opinions on Ethereum’s Future Price Movement
In the face of the ongoing downtrend, analysts and traders in the cryptocurrency sphere remain optimistic about Ethereum’s potential for an upward surge.
MuroCrypto has taken a bullish stance on ETH, expressing his long position with a target set at $2,700. Meanwhile, TheCryptomist sees the possibility of an Ethereum rebound kickstarting an altseason, conveying her enthusiasm through a tweet:
$ETH
Where others are scared, I am excited!!
We have hit my support level from last week.Perhaps smaller TF chop present here.
Should we bounce .. it is ALT SEASON 🚀😘https://t.co/EzINPs8qZ8 pic.twitter.com/fknhqqR0aq— The Cryptomist (@Thecryptomist) January 22, 2024
“While others may be apprehensive, I find excitement in the current scenario. We’ve reached the support level established last week, and there may be some short-term volatility. If a bounce occurs, brace yourselves for ALT SEASON.” Adding to the positive sentiment, VellaCryptoX predicts a price surge towards $2,800.
Analyzing the Ethereum Price: Is the Bottom Near?
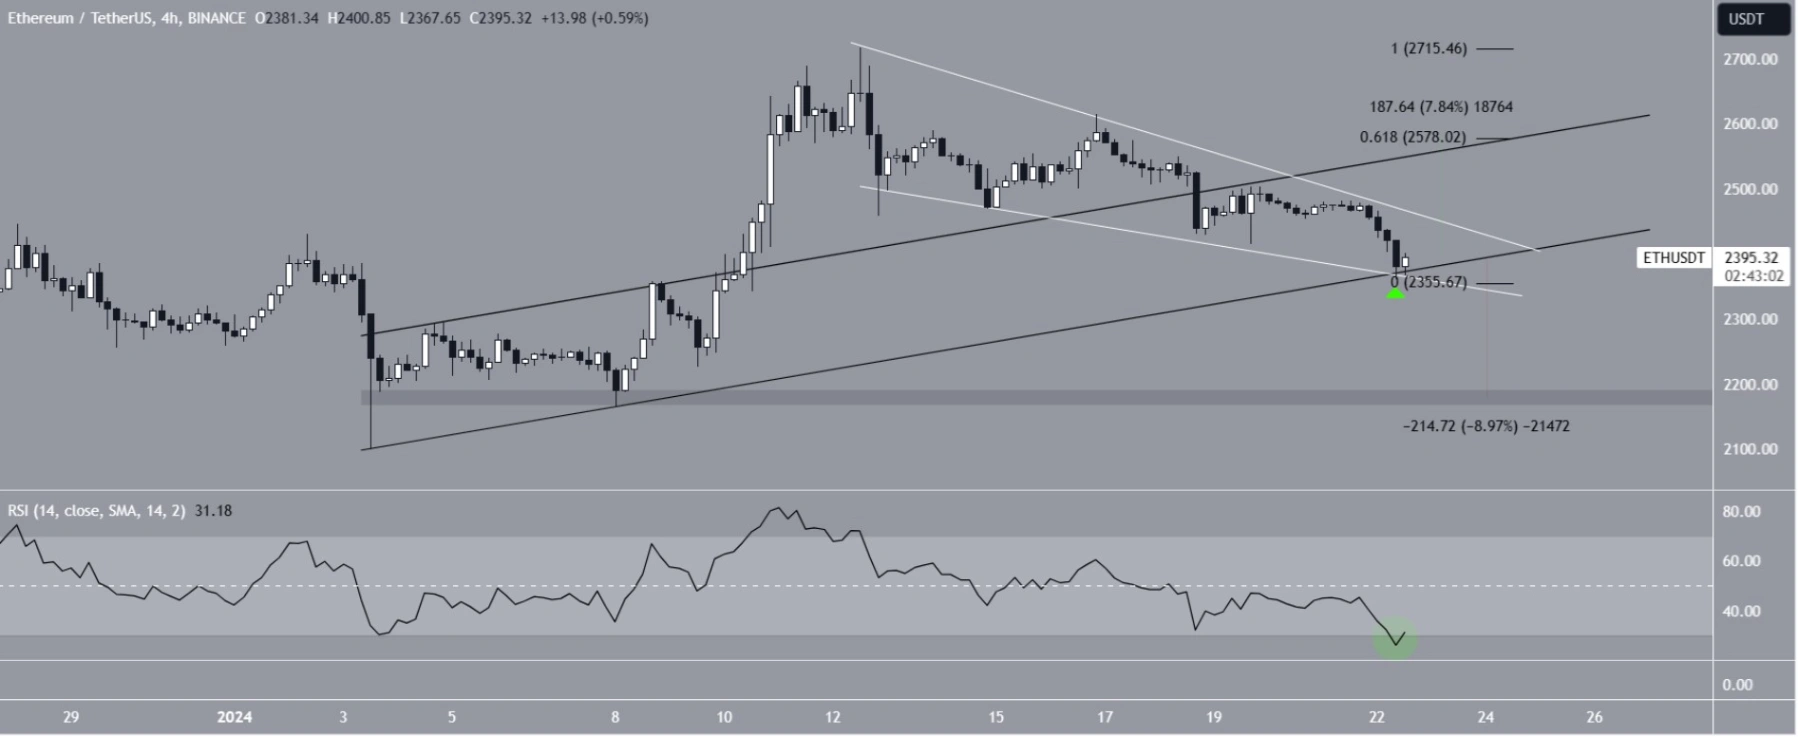
Despite the bearish outlook on the daily time frame, a more granular examination on the four-hour chart suggests a potential rebound. This optimism is grounded in both price action and RSI readings.
Examining the price action reveals a bounce at the support trend line of an ascending parallel channel, coinciding with the support trend line of a short-term descending wedge (depicted in white), which is generally considered a bullish pattern. Furthermore, the four-hour RSI has ventured outside its oversold territory, recovering after briefly dipping below (indicated by the green circle).
Related: Ethereum Foundation Continuously Selling ETH
If Ethereum breaks out of the wedge, an 8% surge is anticipated, leading to the channel’s resistance trend line at $2,580—an area aligning with the 0.618 Fib retracement resistance level. Despite the optimistic price forecast, a breakdown from the channel could trigger a 9% decline, with the closest support lying at $2,170.


