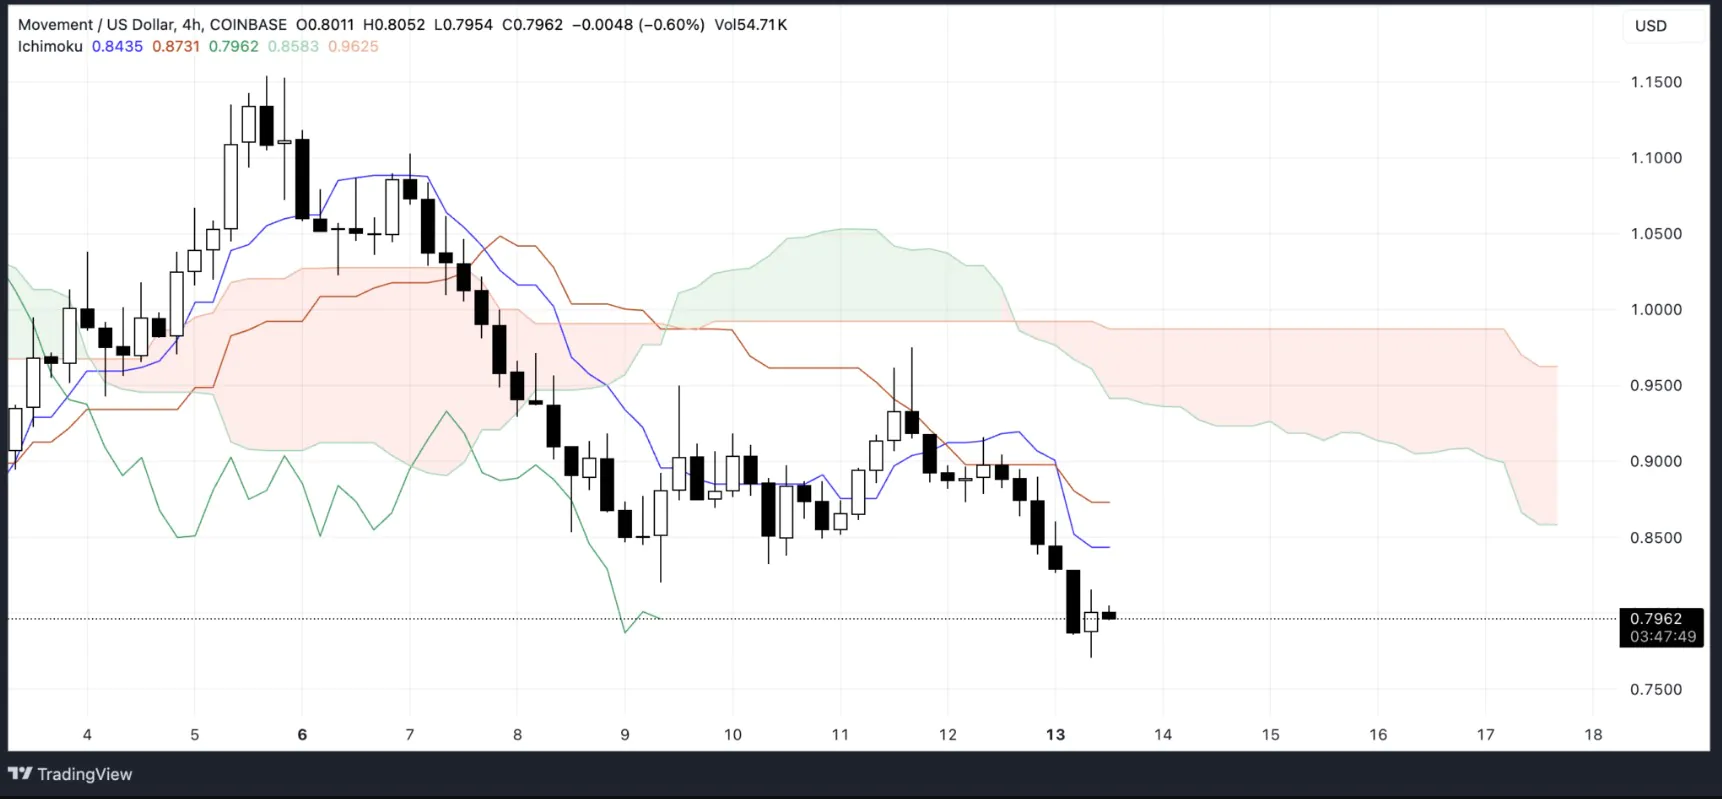
Technical indicators, including the RSI and Ichimoku Cloud, show a strong bearish bias, with MOVE trading near oversold levels and well below the Ichimoku Cloud.
The recent appearance of a “death cross” pattern has further reinforced the bearish bias, signaling increasing selling pressure. For MOVE to recover, it needs to break above key resistance levels. However, if current support fails to hold, MOVE could continue to fall further.
MOVE’s RSI remains near oversold territory
MOVE’s RSI is currently at 33.3, having recovered slightly after hitting 29.7 a few hours ago. This is a significant decline from the RSI level of 53 two days ago, indicating that the asset has quickly moved from neutral to oversold territory.
RSI (Relative Strength Index) is a momentum indicator that ranges from 0 to 100 and is used to gauge whether an asset is overbought or oversold. Typically, a reading below 30 indicates oversold conditions, suggesting that the asset may be undervalued, while a reading above 70 indicates overbought conditions, signaling a potential price correction.

With RSI at 33.3, MOVE remains near oversold territory, which could attract investors looking to take advantage of low prices. This level suggests that recent selling pressure may be waning, offering the potential for price stabilization or recovery.
However, if RSI fails to return to neutral territory, this could signal that bearish momentum is still persistent, continuing to pressure MOVE’s price in the short term, even after Movement Labs, the company behind MOVE, raised $100 million in funding.
MOVE’s Ichimoku Cloud Paints a Negative Picture

MOVE’s Ichimoku Cloud chart shows a clear bearish configuration, with the price trading well below the cloud (Kumo).
The cloud is red and expanding, signaling increasing bearish momentum and continued selling pressure. This indicates that the current trend remains strongly bearish, with no signs of weakening in the short term. The recent correction has seen MOVE drop out of the top 50 altcoins, currently ranking 59th.
Read more: Tether Announces Relocation to El Salvador
The conversion line (blue) remains below the baseline (red), confirming the short-term bearish momentum. Additionally, the lag line (green) is below both the price and the cloud, reinforcing the negative outlook.
The indicators in the Ichimoku system all indicate that the downtrend is still in place, with no clear reversal signals. The overall structure of the cloud and the lines reflect a market environment dominated by selling pressure.


