Ethereum Price Forecast
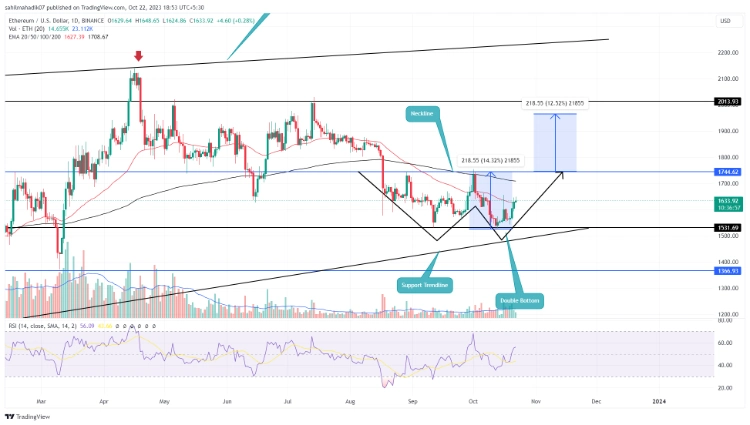
Ethereum (ETH) has demonstrated a promising recovery since rebounding from the $1,530 support level on October 14. This bullish turn of events has resulted in a 6.6% surge in just two weeks, pushing the current ETH price to $1,628. A closer analysis of the daily timeframe hints at the possibility of a bullish reversal pattern known as a Double Bottom.
Signs of a Potential Recovery
- The emergence of a double-bottom pattern has set the stage for a notable uptrend.
- Multiple instances of support around the $1,500 level suggest a strong accumulation zone for traders.
- Intraday trading volume for Ethereum stands at $6.6 billion, marking a 34% increase.
Over the past two months, Ethereum’s price has been locked in a consolidation range between $1,745 and $1,535. While the short-term trend seems to suggest sideways movement, these price levels are significant, contributing to the formation of a double-bottom pattern. Historically, such patterns, especially when they appear at crucial technical support levels, often precede substantial upward movements.
At the time of writing, ETH is trading at $1,630 and is encountering resistance at the $1,650 level, as evidenced by a rejection candle with a long upper wick on the daily chart. A daily close above this minor resistance could potentially fuel the ongoing recovery by approximately 5.2%, setting its sights on challenging the pattern’s neckline at $1,745.
Surpassing this pivotal resistance level would provide more solid confirmation of a sustained recovery, potentially driving the price closer to the $2,000 mark, representing a gain of around 14.5%.
Will Ethereum Maintain the $1,500 Support?
While the immediate outlook for Ethereum’s price appears favorable, it’s essential to recognize that the corrective trend will persist until the price surpasses the last swing high of $1,745. If the current rally faces resistance at this neckline, it could lead to another rejection, prolonging the period of sideways movement. Nevertheless, a long-standing support trendline near the $1,500 mark can offer some protection against significant downturns for ETH holders.
Additional Factors to Consider:
The 50-day Exponential Moving Average (EMA) at around $1,650 provides an extra resistance level for potential buyers.
The daily Relative Strength Index (RSI) trending above 50% indicates a favorable momentum for the price recovery.
Rising Investor Optimism According to Ethereum Fear and Greed Index
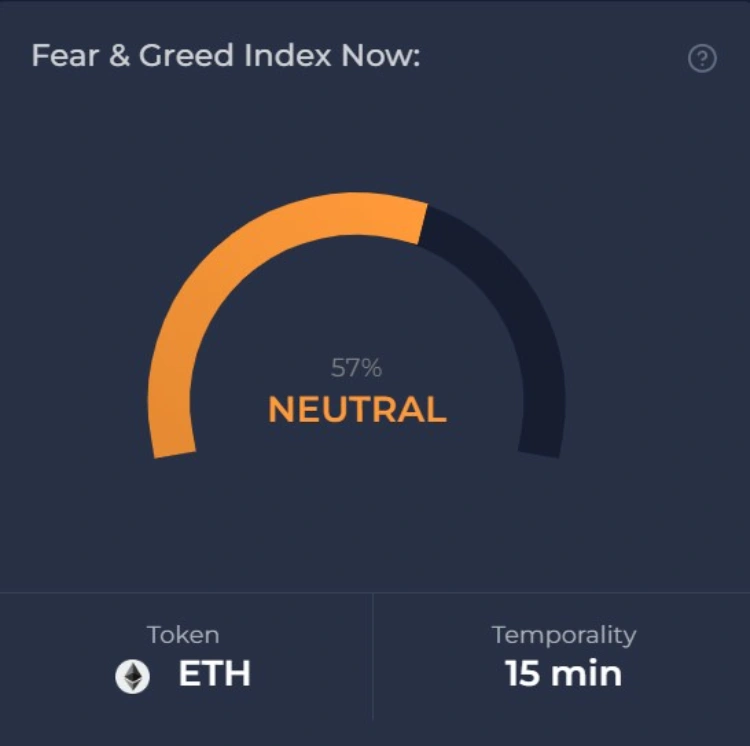
The Ethereum Fear and Greed Index, a widely-used sentiment gauge, currently stands at 55, indicating a shift toward a more optimistic sentiment among investors. This marks a notable increase from previous readings in recent weeks and aligns with the uptrend in Ethereum’s price.
>>> Bitcoin Surges Near $31,000, Pulling 5 Altcoins Upward
Understanding the Index and Its Recent Trends:
The Ethereum Fear and Greed Index offers insights into the collective sentiment of Ethereum investors. Readings below 50 suggest a prevailing sense of fear in the market, while scores above 50 indicate growing optimism. Over the past month, the index has mostly remained in a neutral zone.
For instance, on October 12, the index was at 41, with Ethereum priced at $1,566. In the days leading up to October 11, the index fluctuated slightly within the neutral range of 42 to 45, while Ethereum’s price ranged between $1,566 and $1,576.
The recent shift to 55 suggests a rising bullish sentiment among investors, which corresponds with Ethereum’s price trend.
Ethereum’s Current Status:
As of the latest data, Ethereum is trading at $1,628, reflecting a minor increase of 1.4%, as reported by CoinGecko. In the last 24 hours, the cryptocurrency has traded in the range of $1,603 to $1,646. Ethereum’s market capitalization stands at approximately $196.4 billion, with a 24-hour trading volume of around $8.7 billion.
Investors should exercise caution, however, as a bearish RSI divergence on the 1-hour chart could signal a potential price decline, as highlighted by 100eyes Crypto Scanner.


