Despite this minor pullback, several indicators suggest that the cryptocurrency might resume its upward trajectory soon.
Toncoin finds support from key indicators
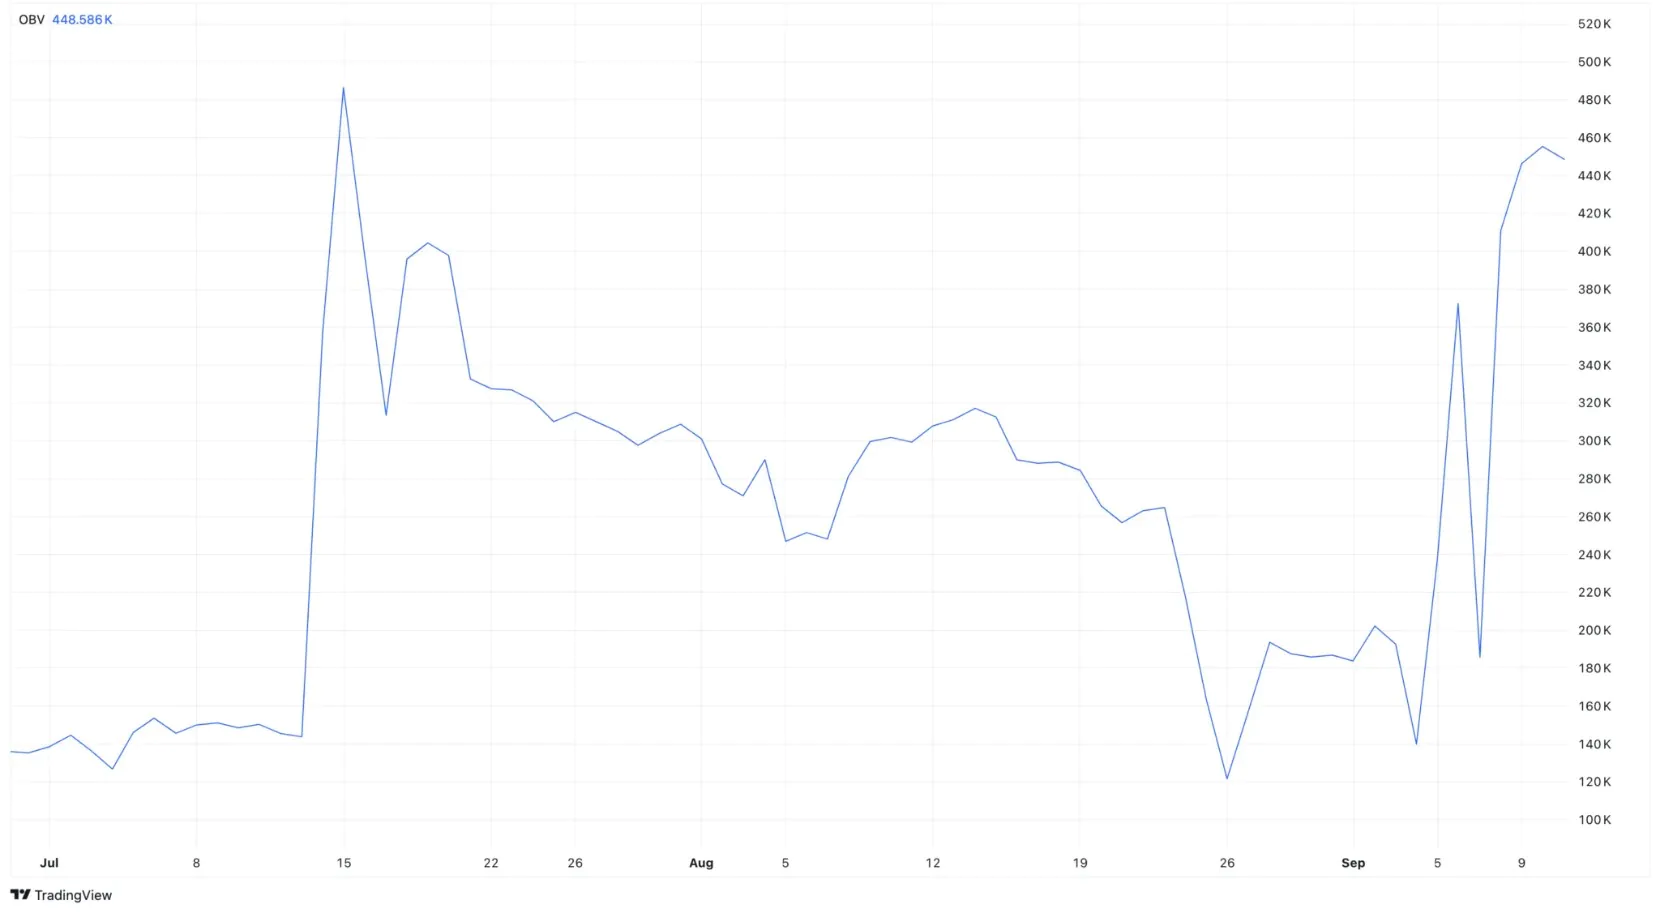
A significant tool backing this outlook is the On-Balance Volume (OBV) indicator, which leverages trading volume to predict price movements. On the daily Toncoin chart, OBV has surged.
Typically, a decline in OBV signals higher selling volume compared to buying, indicating increased selling pressure that could drive prices down. However, in TON’s case, the rising OBV points to more tokens being bought than sold. If this trend continues, the token’s price may maintain its prior upward momentum.

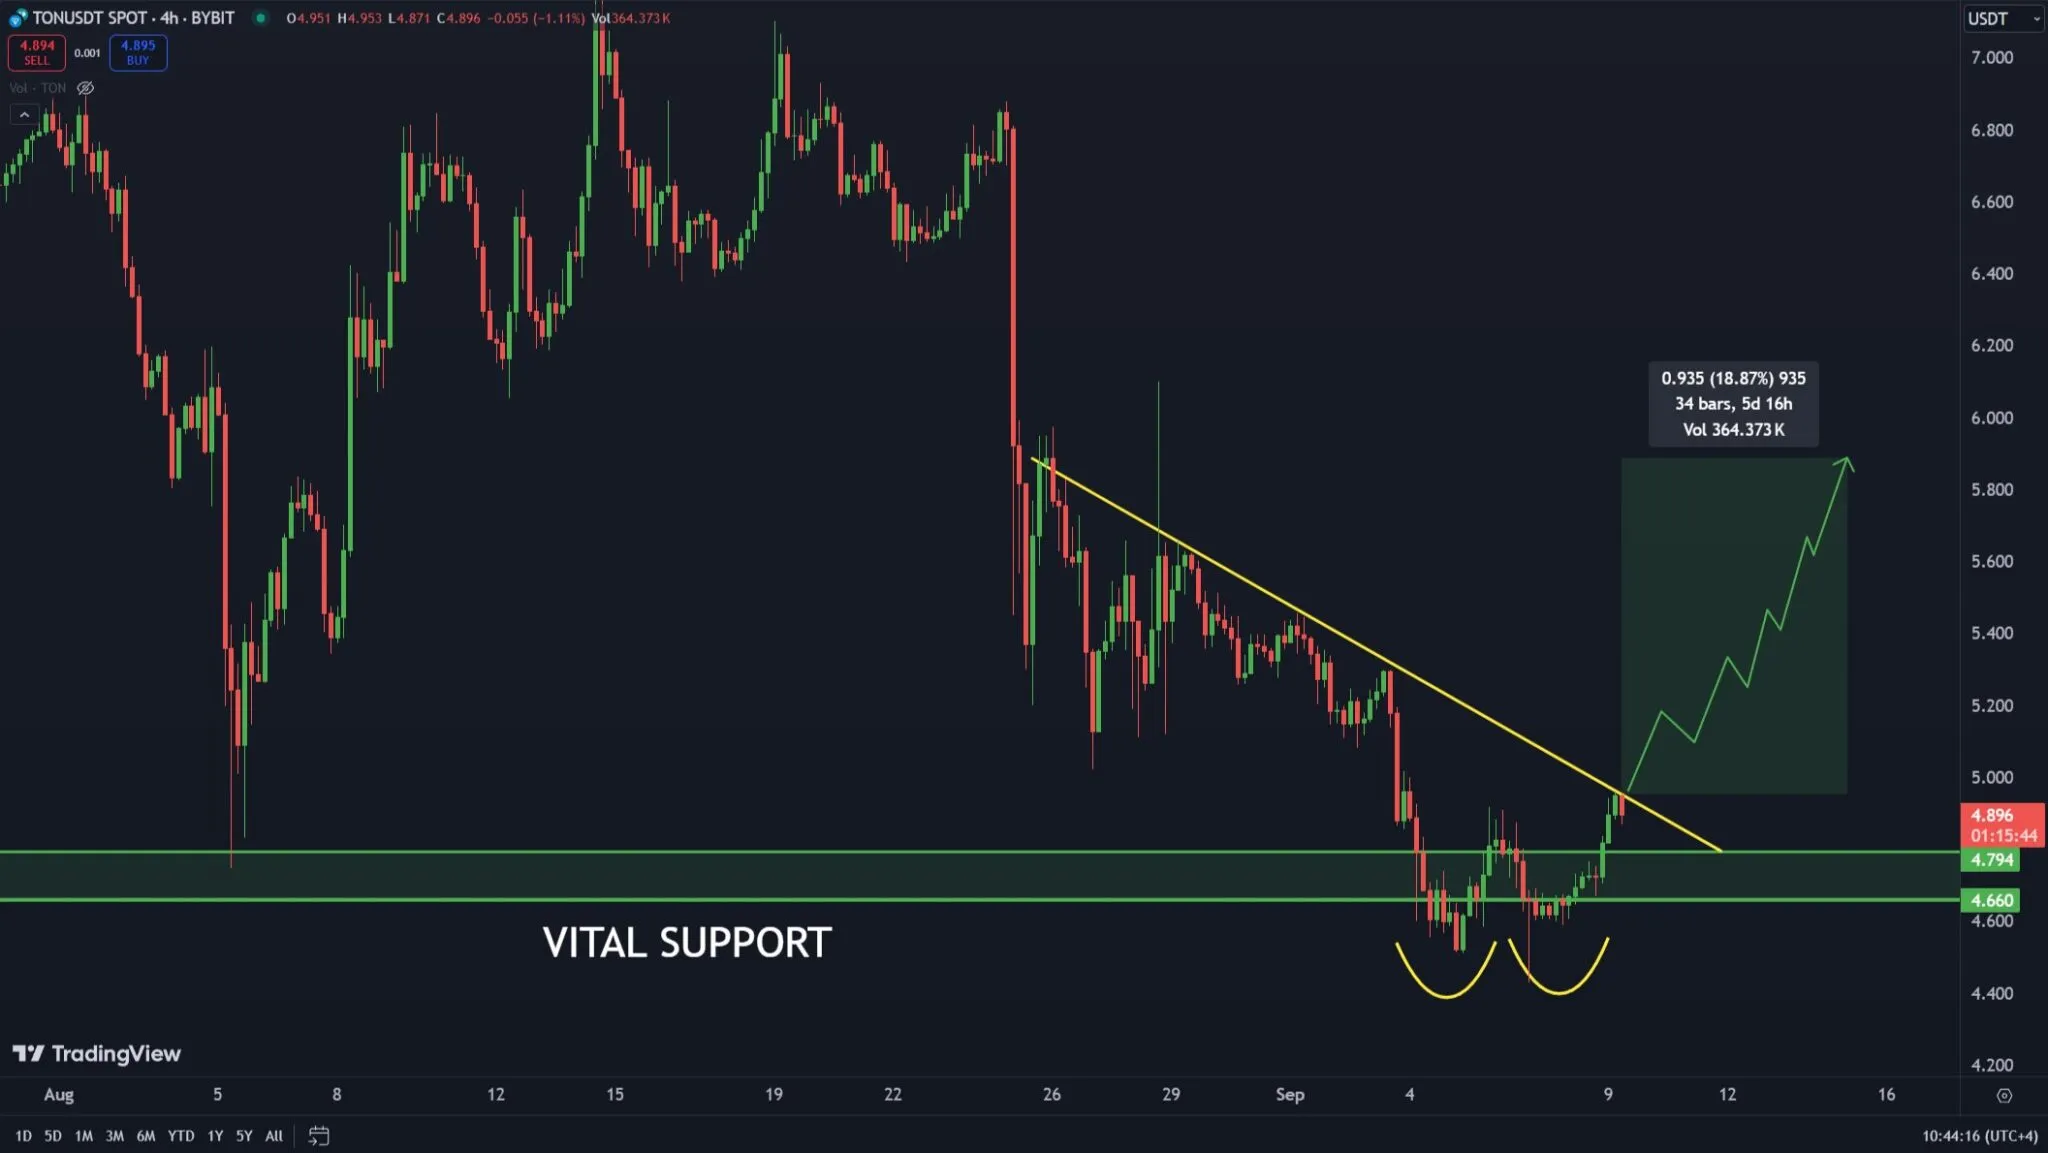
Notably, crypto analyst TheMoonCarl shares a similar sentiment. In a post on X, he highlighted that Toncoin’s price has formed a double-bottom pattern, which often indicates a bullish reversal.
The double-bottom pattern suggests that sellers are losing momentum, and a potential reversal from a downtrend to an uptrend could occur. Based on TheMoonCarl’s analysis, the token may break past the $6 level once it surpasses the descending trendline.
The analyst stated, “TON is attempting to break through the descending resistance after forming a local double bottom at the support zone.”

TON Price Prediction: $7 Within Reach
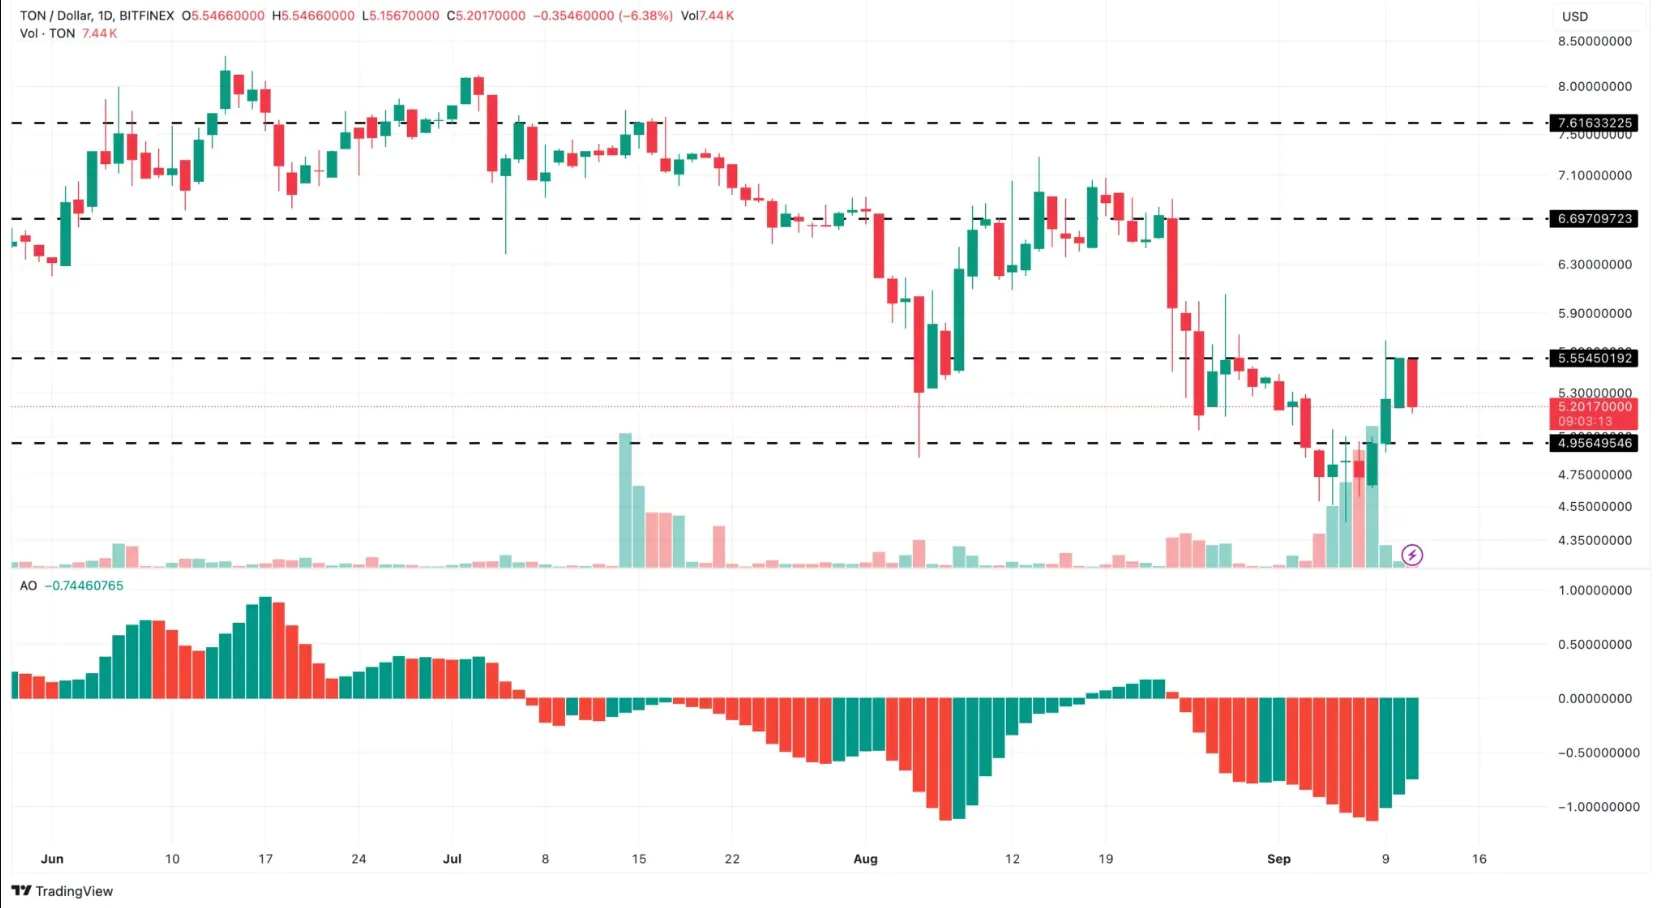
On the daily chart, Toncoin shows solid support around $4.95, indicating it might avoid another significant correction. This support level could help TON resist dropping below $5.
The green bars displayed by the Awesome Oscillator (AO) also back this outlook. The AO measures momentum and price trends by comparing short- and long-term moving averages. Although the current AO value is negative, signaling a downtrend, the green bars suggest that this decline might be temporary.

As a result, TON’s price could rise rapidly, potentially targeting $6.69. Under strong bullish conditions, the price might even reach $7.61. However, if TON drops below $5, it could experience further losses, possibly falling under $4.95.


