Will Bitcoin’s Bull Run Continue in November?
Bitcoin had a strong start to Q4 2023 with a significant price surge. However, the outlook for November is uncertain, with some indicators pointing to potential bearishness.
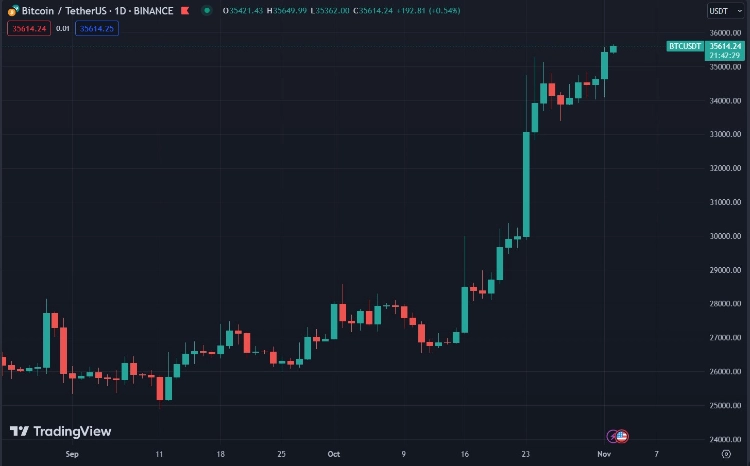
Bitcoin (BTC) recently experienced a robust rally, thanks to favorable market conditions. During the first month of Q4 2023, BTC’s price increased by more than 22%, fueling optimism among investors that it could achieve new all-time highs ahead of its upcoming halving. As we step into November, it’s crucial to assess how BTC’s metrics are shaping up.
Reviewing Bitcoin’s Performance in October
In the past month, the leading cryptocurrency made substantial gains, with its value surging by over 23%. Even in the last seven days, the coin’s price managed to eke out a 1% increase.
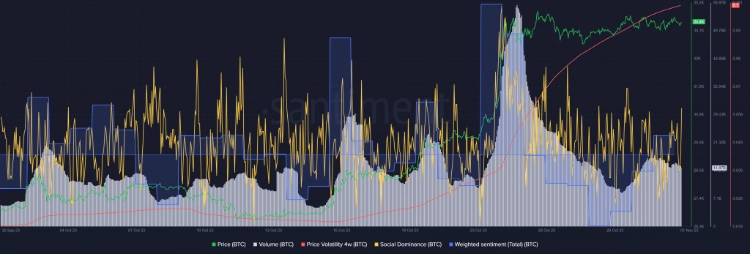
At the time of writing, Bitcoin was trading at $34,439.75, boasting a market capitalization exceeding $672 billion, according to CoinMarketCap. A glance at Santiment’s chart revealed a significant uptick in BTC’s trading volume during its price surge. Consequently, the coin’s 4-week price volatility has shown an upward trend in recent weeks.
Moreover, Bitcoin’s popularity remained high in the past month, evident from the notable increase in its social dominance.
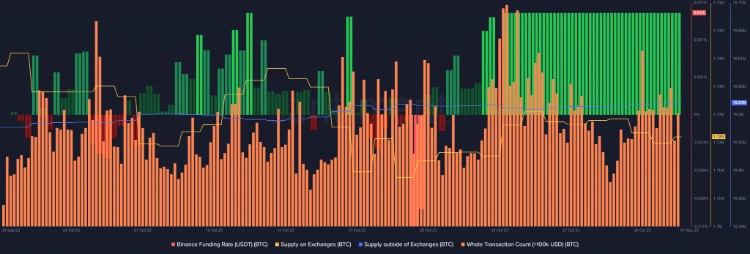
In October, BTC’s weighted sentiment experienced multiple upward swings, reflecting a prevailing positive sentiment surrounding the cryptocurrency. Santiment’s data indicated sustained interest from large-scale investors, as the whale transaction count remained elevated throughout the month.
Notably, it wasn’t just whales showing interest; derivatives investors also exhibited a strong appetite for BTC, evident from the green Binance funding rate. Additionally, the balance between BTC’s supply outside of exchanges and on exchanges was nearly identical, signaling heightened buying pressure on the coin, generally viewed as a favorable signal.
A Glimpse at BTC’s Mining Sector
The mining industry thrived amidst the price surge. According to Coinwarz, BTC’s hashrate steadily increased over the past few months, indicating active participation in mining activities.
At the time of this update, BTC’s hashrate stood at an impressive 466.04 EH/s. This surge in the blockchain’s hashrate correspondingly led to an increase in its mining difficulty, reaching 62.46 T.
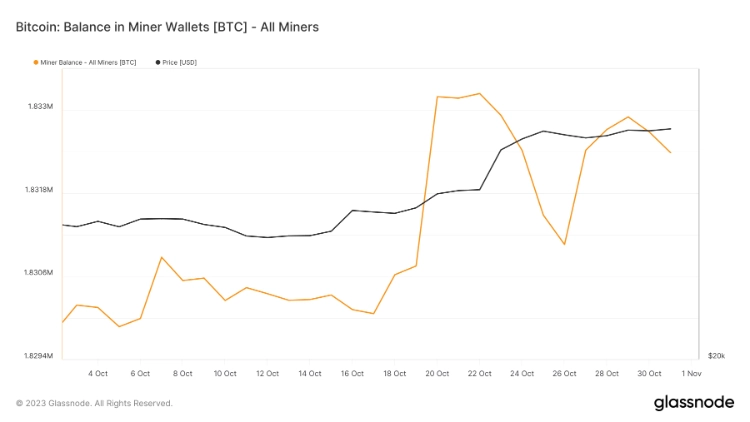
Furthermore, several other metrics demonstrated strong confidence in the cryptocurrency as a whole. BTC miners’ balances witnessed substantial growth last month. Thanks to the recent upward price trend, BTC miners’ revenue remained stable throughout the month, as reported by Glassnode.
Can Bitcoin Sustain Its October Momentum in November?
In October 2023, Bitcoin exhibited a bullish performance, rekindling hope among investors during a period that had witnessed the lengthiest bearish market since the inception of cryptocurrency. Now, the big question is whether BTC can carry forward the positive trend into November. A closer examination of the blockchain’s current state provides insights into what to anticipate in the second month of the final quarter of 2023.
>>> Bitcoin Surges to $35K USD, MicroStrategy Increases Holdings
A notable crypto analyst known as Moustache recently shared an intriguing observation on Twitter (or X, as it is now known) regarding the leading cryptocurrency. According to the tweet, BTC’s True Strength Index (TSI) exhibited a bullish pattern on the daily chart. TSI is a technical momentum oscillator employed to identify trends and reversals.
Historically, whenever TSI has shown a bullish crossover, it has often been followed by a parabolic surge. This suggests a reasonable probability of Bitcoin continuing its bullish rally in the coming month.
#Bitcoin
$48.000 is inevitable.
The monthly close becomes decisive. Every time the TSI has crossed bullishly, we have seen a parabolic curve afterwards.
Then $48.000 will only be an intermediate target and $BTC will go much higher. pic.twitter.com/o13P0bEWgC
— 𝕄𝕠𝕦𝕤𝕥𝕒𝕔ⓗ𝕖 🧲 (@el_crypto_prof) October 31, 2023
While market indicators appeared to favor Bitcoin, a different narrative emerged when scrutinizing its daily chart. BTC’s price had already breached and dipped below the upper Bollinger bands, a bearish signal. The Relative Strength Index (RSI) had ventured into overbought territory, potentially exerting downward pressure on the coin.
Following a steady uptrend, Bitcoin’s Chaikin Money Flow (CMF) was showing a slight downturn. Adding to the mixed signals, Bitcoin’s Moving Average Convergence Divergence (MACD) indicated the likelihood of a bearish crossover in the near future, heightening the prospects of a price decline in the days ahead.
In light of the diverse metrics at play, it will indeed be intriguing to observe the direction in which Bitcoin’s price evolves in the upcoming weeks.


