High Volatility in Ethereum Following Breakout of Key Price Pattern

ETH is currently trading at a significant support level, with key technical indicators suggesting a potential further decline in its value.

Azcnews High Volatility In Ethereum Following Breakout Of Key Price Pattern

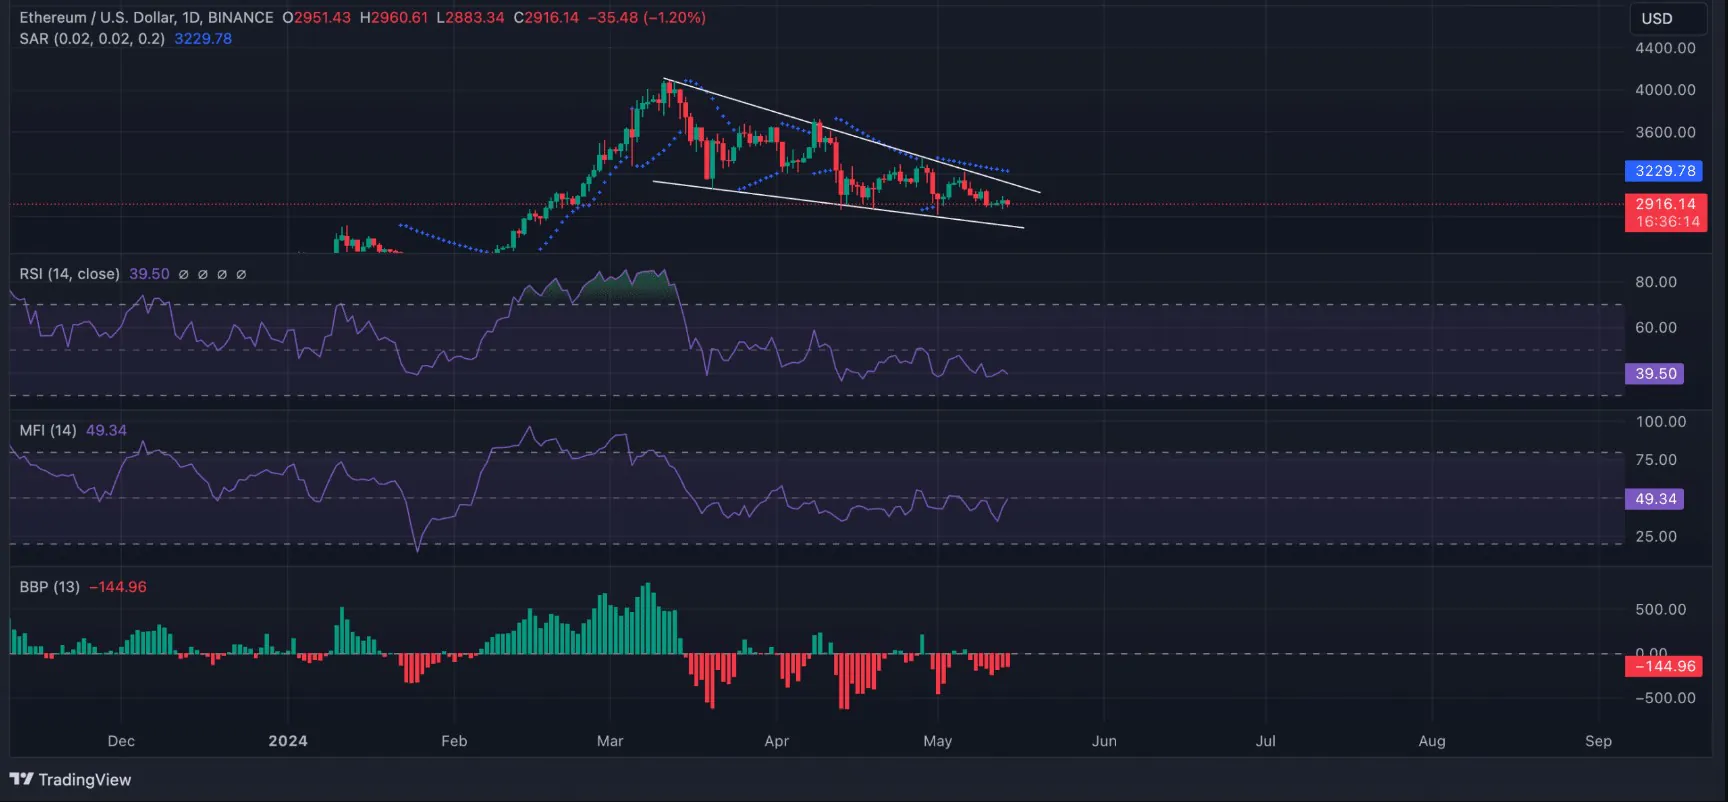
Leading Ethereum-based altcoin [ETH] is facing a critical support level as its price is currently moving within a descending channel. Descending channels typically appear when an asset’s price continuously makes lower highs and lower lows, indicative of a broader downtrend. Data on ETH’s price movement on the daily chart shows that this trend started on March 12. As of press time, the altcoin is trading at $2,915, according to data from CoinMarketCap.

The question is, is there a break below or above?

If ETH bulls cannot maintain the coin’s current support, located at $2,850, we will likely see its price continue to fall below the lower trendline of the descending channel. In this case, the altcoin could fall to the $2600 level.
Ethusdt
Ethusdt

Several key technical indicators are hinting at the possibility of the price falling below current support levels. For example, key ETH momentum indicators show that the sell-off has exceeded accumulation by market investors.

ETH’s RSI is currently at 39.52, while the MFI is at 49.39, both at their respective neutral points at this time.

The Elder-Ray Index for ETH shows negative values, confirming the current bearish trend. This is an indicator that measures the relationship between the power of buyers and sellers in the market. When this index is negative, it shows that selling pressure is dominating the market.

Related: Bitcoin and Ethereum Exhibit Low Correlation with Market

Similarly, Parabolic SAR dots for ETH have appeared above its price since early May. This is an indicator used to determine the direction and potential reversal of a trend. When these dots are placed above the price of the asset, the market is considered to be in a bearish phase. This indicates that the price of the asset has fallen and may continue to fall.

If ETH price must break below the current support, the coin’s next price drop could fall to $2780. However, if this prediction turns out to be incorrect, the altcoin could rise above $3000.

0.0/5

Love
  1. Avatar of
    Anonymous

    Ok

Comments are closed.

Latest

Azcnews A Trader Turns $90 Into $3.25 Million With Ufd

News | Altcoin | Editor Choice | Memecoin

A Trader Turns $90 into $3.25 Million with UFD

An impressive crypto trading experience happened when a trader decided to invest in UFD, a new meme coin on the Solana platform, and made a profit of up to $3.25 million in just 2 days.

Frame 173 (1)

AI | Editor Choice | News | PRESS RELEASES

Explore AZCoiner IDO: Opportunity to Invest in AZC at Great Price

Join AZCoiner's IDO on Kommunitas! Acquire AZC tokens at an exclusive price and seize the opportunity for significant growth. Don’t miss out!

Michael Saylor Gifts Christmas Presents To Microstrategy Shareholders In Bitcoin

News | Bitcoin | Bitcoin Layer2 | DePin | Editor Choice | GameFi | Memecoin | Newbies

Michael Saylor Gifts Christmas Presents to MicroStrategy Shareholders in Bitcoin

Michael Saylor has decided to gift Bitcoin to MicroStrategy shareholders as a Christmas present, corresponding to the profits the company generated in the past week.

A Major Canadian Company Begins Buying Bitcoin

News | Bitcoin | Editor Choice

A Major Canadian Company Begins Buying Bitcoin

Canadian real-world asset tokenization company Matador Technologies has become the latest company to add Bitcoin to its portfolio.

Defi Hack Losses Decrease Significantly, Cefi Sees Strong Growth In 2024

News | Altcoin | Bitcoin | Bitcoin Layer2 | DePin | Editor Choice | GameFi | Memecoin | Newbies | Pi Network | Video

DeFi Hack Losses Decrease Significantly, CeFi Sees Strong Growth in 2024

In 2024, DeFi suffered losses of $474 million due to hacks (a 40% decrease), while CeFi faced severe losses amounting to $694 million.