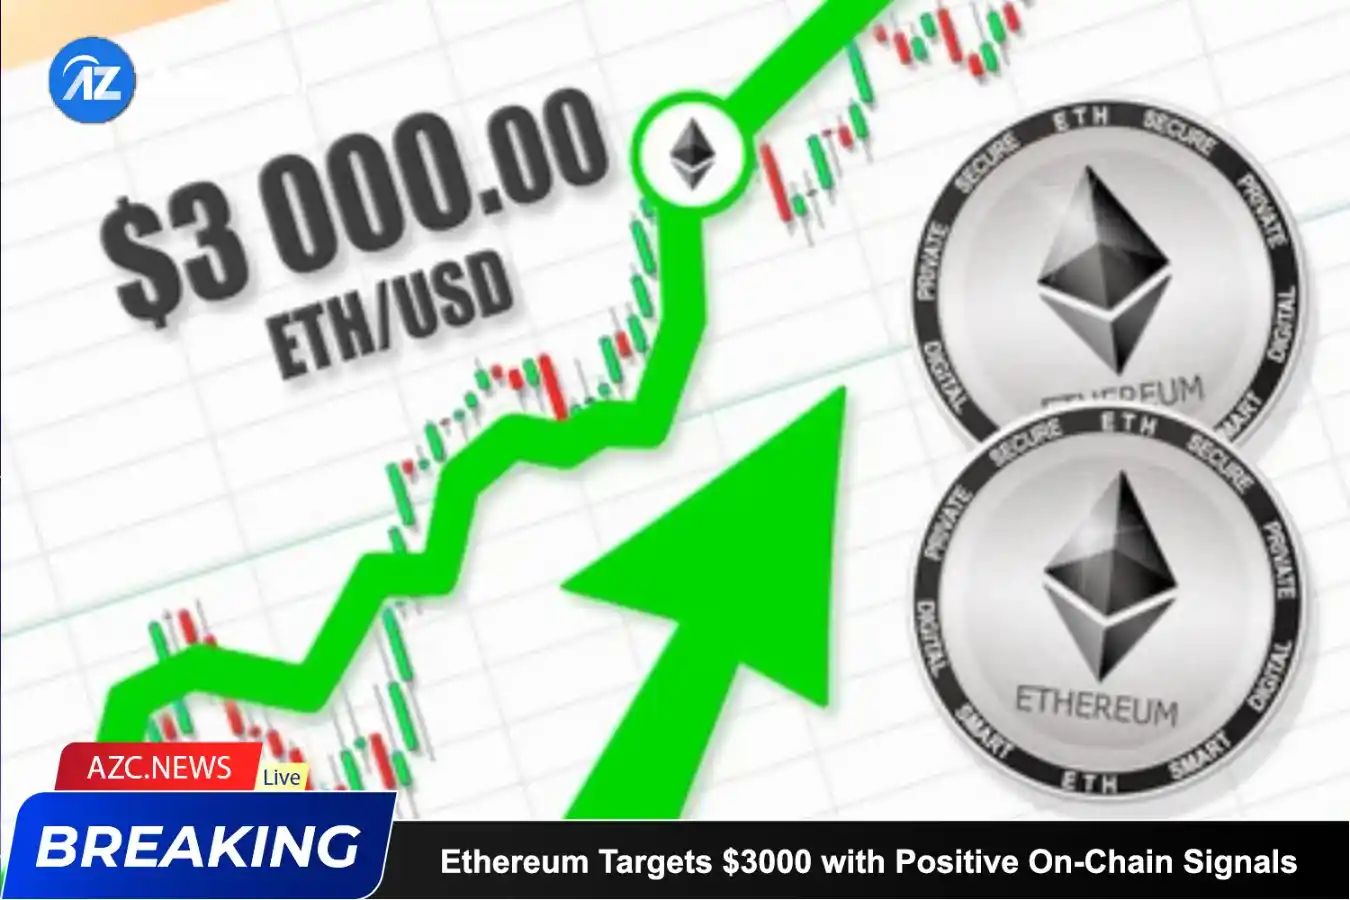
Since mid-December, Ethereum (ETH) has consistently traded within a defined range, fluctuating between $2116 and $2614, with a midpoint around $2365 serving as a stable reference point for the past ten weeks.
On February 12th, Ethereum’s value surpassed the upper boundary of this range, closing the trading day at $2659. Subsequently, as the price continued its ascent, the number of liquidated short positions saw a noticeable uptick.
Historically, both in 2017 and during 2020-21, substantial growth in unique active addresses corresponded with significant increases in market value. However, post-November 2021, despite a decline in these address numbers, attempts to breach the $4k resistance were unsuccessful.
The upward trajectory observed with Ethereum traces back to October 2023, as indicated by the 7-day simple moving average on active addresses, reflecting a steady increase according to CryptoQuant data.
Nevertheless, over the past two years, this metric has not demonstrated a consistent pattern of rising lows and highs, implying that a firmly established upward trend for the number of active addresses has yet to materialize.
The price of ETH has now reached levels not witnessed since May 2022. This resurgence may indicate a potential surge in Ethereum network users in the forthcoming months and years, leading to increased demand and consequently, enhanced token value.
Derivatives markets currently reflect a predominantly optimistic outlook, as revealed by AZC News through an analysis of open interest (OI) data spanning the last three years provided by CryptoQuant. Extended upward trends in OI have consistently aligned with a sustained uptick in investor optimism.
From October 2023, the 7-day moving average of OI surged from $1.7 billion on October 1 to $6.74 billion on February 15. This simultaneous increase in OI, coupled with the upward movement in price, underscores the prevailing confidence in the futures market.
An examination of settlement levels on Hyblock’s map unveiled a breach in the $2730 to $2835 range, an area encompassing multiple liquidation points valued between $10 billion and $15 billion. The breach indicates a potential hurdle for ETH near $2900, following its surpassing of these significant liquidity pockets.
Related: Ethereum Aims for $3,000 with Positive Sentiment
Analysis of liquidity availability over the past six months reveals a scarcity near $3000. Consequently, a logical scenario involves a pullback towards the $2000 range to consolidate settlements. However, the possibility of a negative adjustment remains uncertain, given the strength demonstrated by buyers in recent weeks. A decline below $2500 may signal a potential correction towards $2000, while a drop into the $2500-$2600 range could present a buying opportunity.

