Ethereum Nears the $2,000 Mark
Altcoins are currently surging, joining Bitcoin in a collective market upswing. This wave of enthusiasm has elevated the entire cryptocurrency market by 7.5%, pouring over $150 billion into the pockets of investors.
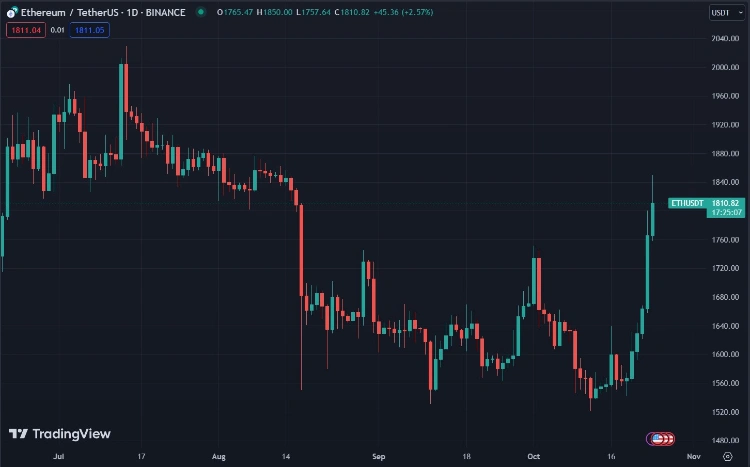
Ethereum, in particular, has been a standout leader in this altcoin surge. As Bitcoin reached its highest point in 2023 at $23,000, Ethereum (ETH) made an impressive 8% gain, breaching the $1,800 threshold and setting its sights on the coveted $2,000 mark. With this surge, Ethereum’s year-to-date gains have exceeded 50%.
A noteworthy development in this context is the recognition by the US SEC of Grayscale’s application to transform its Ethereum Trust (ETHE) into a spot Ethereum ETF. This news has further fueled the optimism surrounding Ethereum.
SEC has acknowledged Grayscale’s spot ether ETF filing…
This would be conversion of $ETHE into ETF. pic.twitter.com/JMmutgbakZ
— Nate Geraci (@NateGeraci) October 23, 2023
In terms of technical analysis, Ethereum has broken past the $1,745 level following a double bottom formation, and other indicators suggest a sustained upward trajectory. If traders continue to maintain their open buy orders, there is a potential for a 12.25% breakout, reaching $1,958. This breakout could be accompanied by a surge in trading volume, as traders seek fresh opportunities with Ethereum surpassing the neckline resistance.
The Relative Strength Index (RSI) currently stands at 75, signaling Ethereum’s ability to maintain its upward trend. However, investors should exercise caution, as overbought conditions may tempt traders to secure profits or protect their investments.
The Money Flow Index (MFI), which monitors the flow of capital in and out of the market, indicates an advantage for the bulls. A consistent increase in MFI signifies buyer dominance within the upward trend.
If Ethereum manages to surpass the $2,000 milestone, it could be a pivotal moment for Ethereum bulls, potentially acting as the catalyst for the next bull run.
Among the top ten cryptocurrencies, Cardano (ADA) and Dogecoin (DOGE) have followed a similar trajectory to Ethereum, each gaining 8%. BNB Coin and Ripple XRP have seen 4% gains.
Conversely, Solana, which has been a standout performer, is currently displaying a more subdued trend, potentially entering a consolidation phase after recording a remarkable 30% weekly gain.
Dogecoin Price Prediction
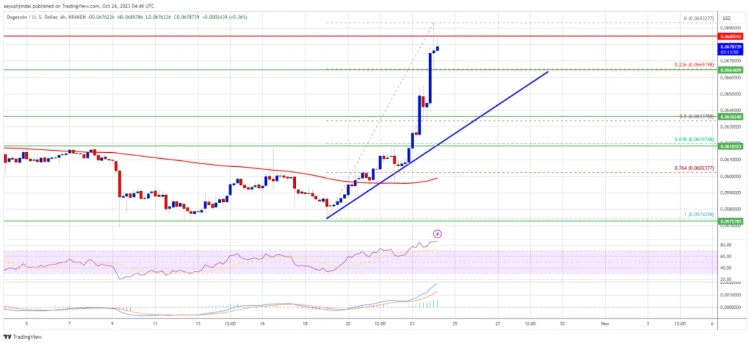
Dogecoin’s price is on an upward trajectory, having surpassed the $0.065 resistance against the US Dollar. If DOGE manages to clear the $0.070 resistance zone, it could experience a substantial rally of over 20%.
The recent movements of DOGE have been promising. It initiated an ascent above the $0.0625 resistance and currently hovers below the $0.0650 level, which is also just below the 100 simple moving average (4 hours).
A key bullish trend line is taking shape with support around $0.0650 in the DOGE/USD pair on the 4-hour chart, as per data from Kraken. This formation is encouraging for further positive price action.
Should DOGE successfully breach the $0.070 resistance, it may embark on a robust rally akin to Bitcoin’s recent performance. The cryptocurrency has established a base above $0.0575, surpassed the $0.060 resistance zone, and entered a favorable zone.
The recent upticks in both Bitcoin and Ethereum have contributed to DOGE’s upward movement. The price has exceeded the $0.0650 resistance area, reaching a peak around $0.0693 before consolidating its gains. Additionally, it remains above the 23.6% Fibonacci retracement level, calculated from the recent low at $0.0574 to the high at $0.0693.
Currently, DOGE is trading above $0.065, with support from the 100 simple moving average (4 hours). The $0.0685 level poses an initial resistance, and there is further support from the mentioned bullish trend line near $0.0650.
The primary hurdle lies at $0.070, and a breakthrough could propel the price towards $0.0735. Beyond that, the next significant resistance stands at $0.0750, and further gains could potentially push DOGE toward $0.080.
In case DOGE encounters difficulties in surpassing the $0.070 level, a downside correction might be triggered. Initial support is around $0.0665, followed by a more substantial support level at $0.0650. A breach below $0.0650 could lead to further declines, possibly targeting the $0.0632 level or the 50% Fibonacci retracement level of the recent rise from the low at $0.0574 to the high at $0.0693.
Related: Uniswap Foundation will Share Fees with Users
Key Technical Indicators:
- 4 Hours MACD: The MACD for DOGE/USD indicates a bullish trend gaining momentum.
- 4 Hours RSI (Relative Strength Index): The RSI for DOGE/USD is above the 50 level, reflecting positive sentiment.
Key Support Levels:
- $0.0665
- $0.0650
- $0.0632
Key Resistance Levels:
- $0.0685
- $0.0700
- $0.0750


