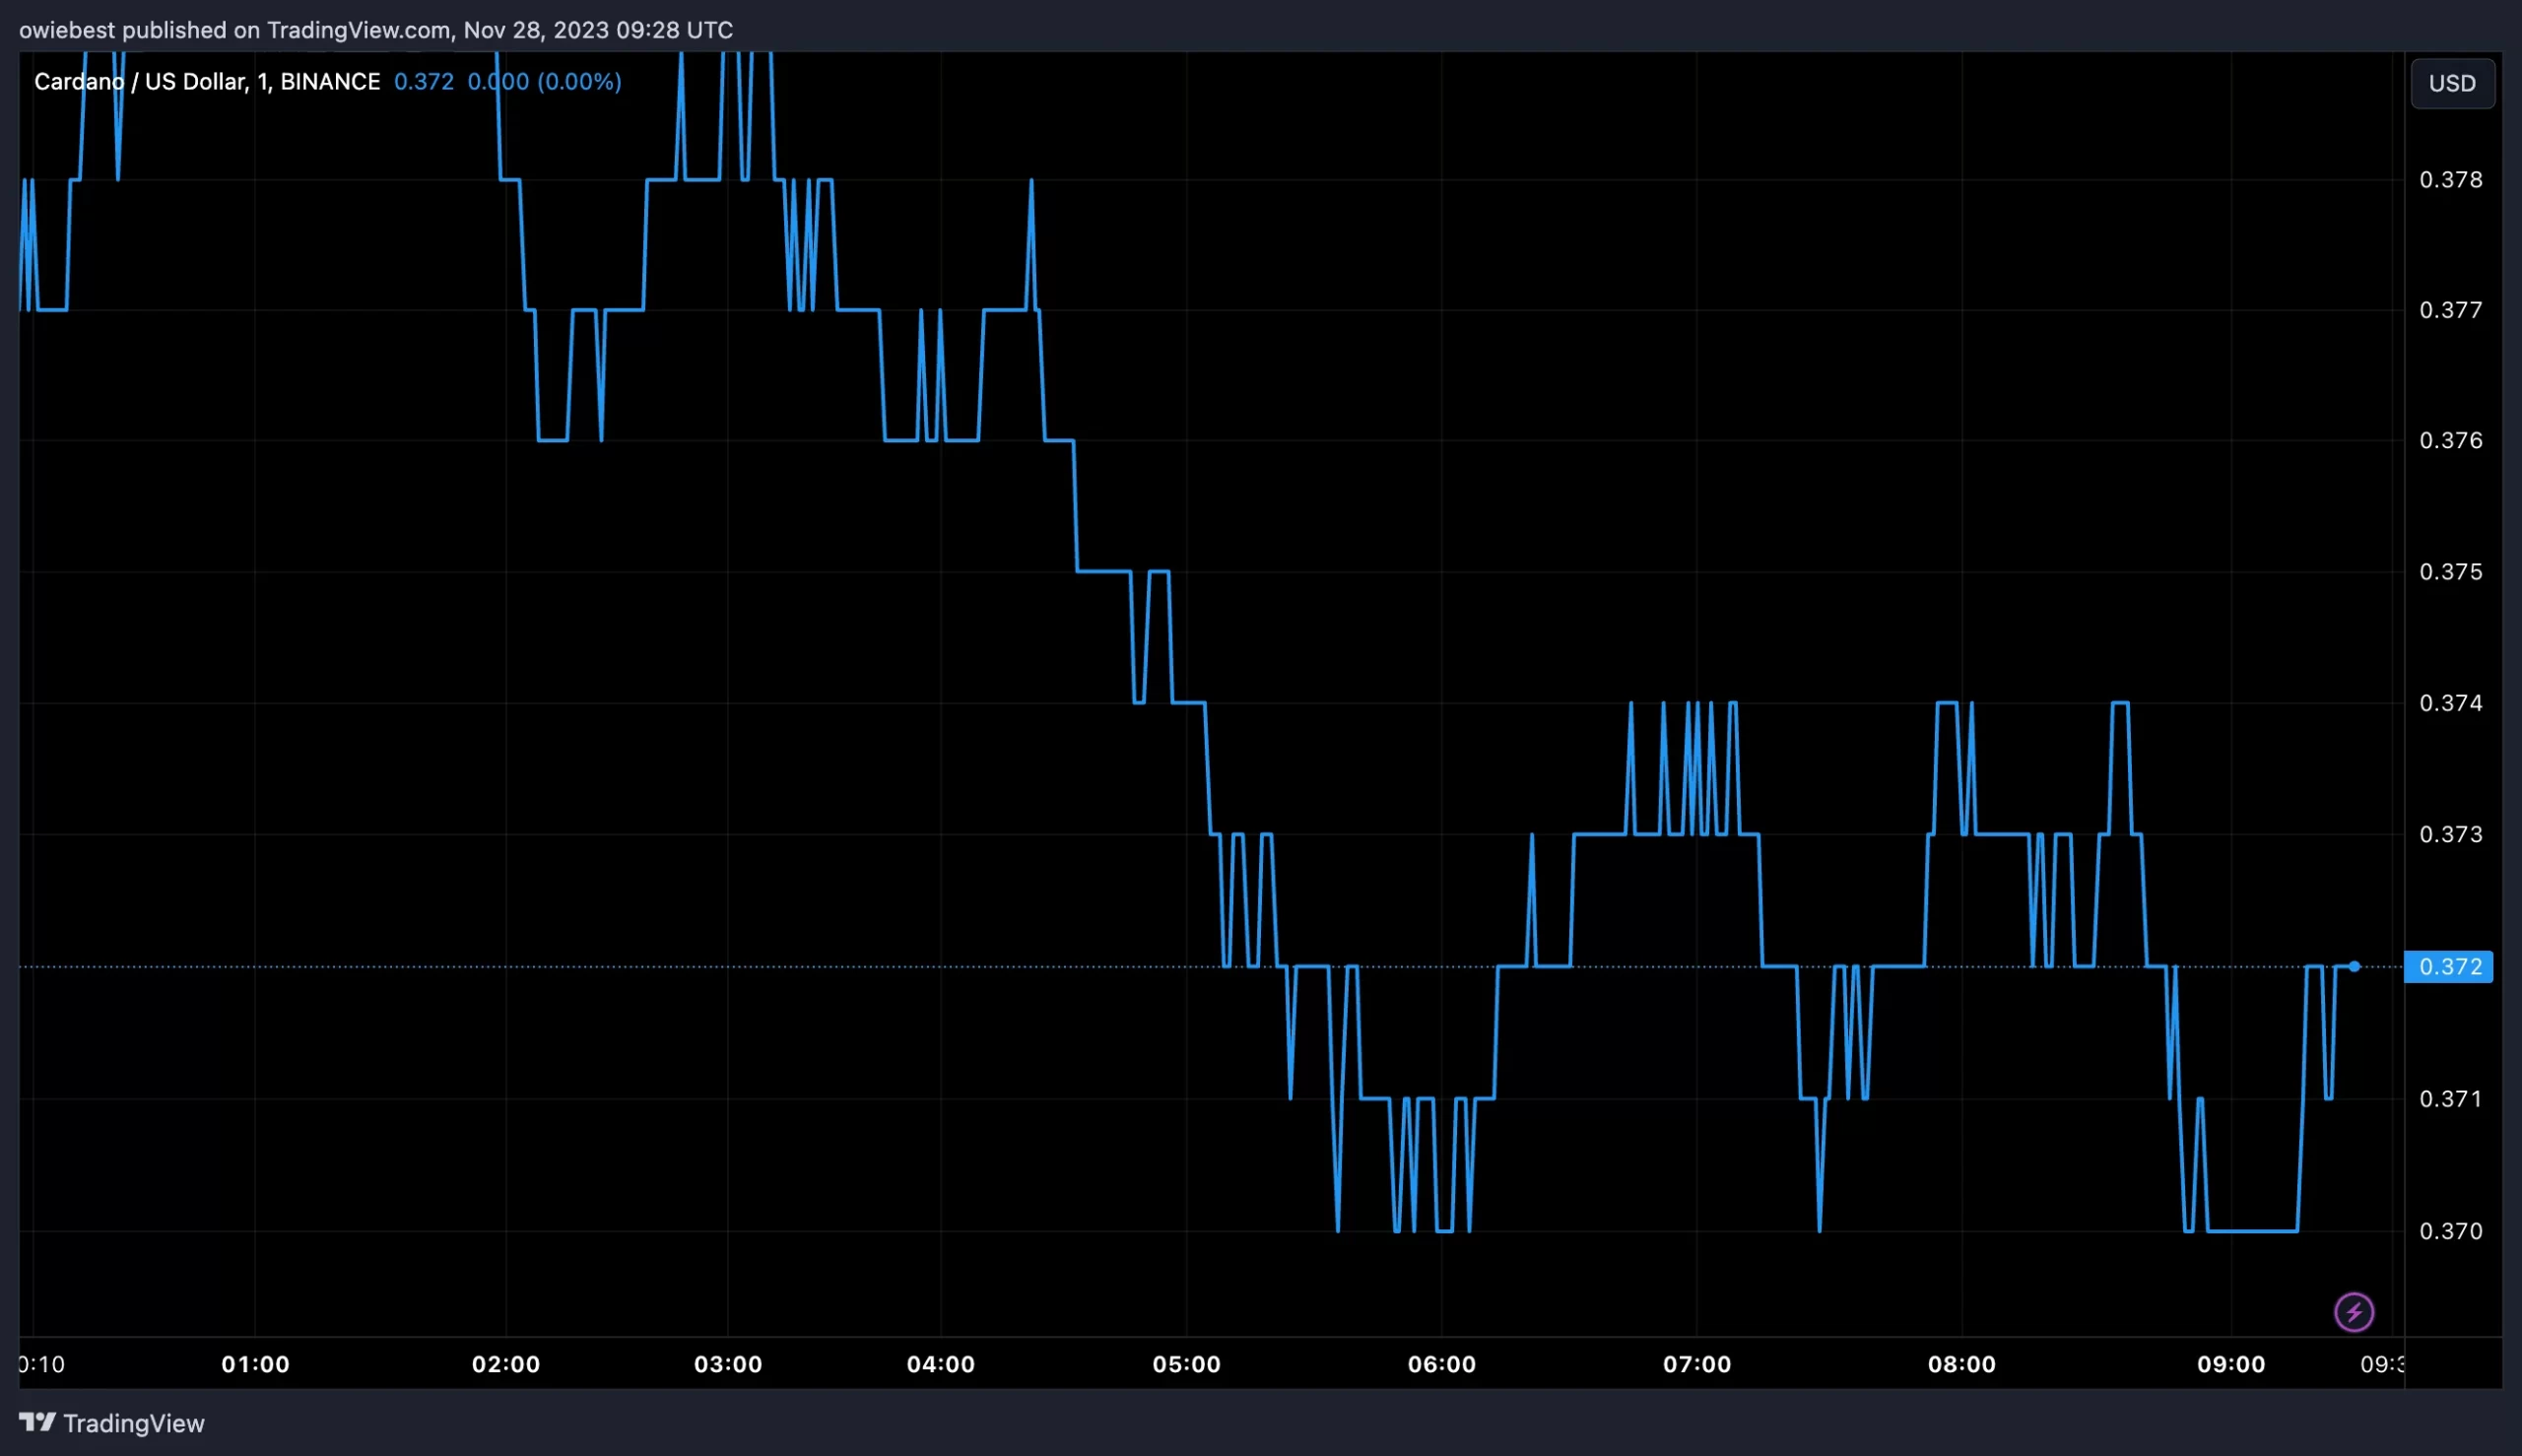
Ali’s chart analysis emphasizes the significance of this demand zone, attributed to substantial accumulation activity in the region. Around 166,470 wallets acquired approximately 4.88 billion ADA at these levels, establishing them as entry points.
This extensive accumulation not only suggests considerable investor support but also creates a robust foundation for price stability. Ali notes the minimal resistance above this level, stating, “With minimal resistance ahead and solid support below, remaining above this zone could pave the way for $ADA to climb to new yearly highs.”
Despite the optimistic scenario, Ali cautions investors about the critical nature of this level. While substantial support exists, a dip below this range could have adverse consequences for the price. He warns, “Still, watch out, as losing this support level could trigger a brief correction to $0.34.”
ADA Price Poised for $0.46 Surge, Despite Short-Term Concerns
In a recent update, the crypto analyst highlighted the emergence of a sell signal on the weekly Cardano TD Sequential indicator, suggesting potential downside for the asset. The risk is amplified if ADA fails to maintain the identified support at $0.37, with a breach risking a decline to the $0.33 to $0.34 range.
The bearish outlook could be invalidated if ADA successfully closes above $0.4, a resistance level it has struggled to overcome. Such a breakthrough would signal strong bullish momentum and could propel ADA towards an “advance toward $0.46.”
Examining the 4-hour chart, the analyst notes the significance of the 100-EMA as a rebound zone, contrasting it with the formidable resistance at $0.396. The TD Sequential indicator in this timeframe presents a buy signal around the 100-EMA, anticipating a potential rebound.
Related: What is The Difference Between VeChain and Cardano?
Closing the analysis, Ali emphasizes the importance of monitoring a 4-hour candlestick close above $0.396 or below the 100-EMA to confirm the direction of ADA’s trend.


