Last night, Bitcoin experienced a remarkable price surge, breaking through the $110,000 mark and triggering a wave of gains across the altcoin market. After escaping a downtrend pattern and establishing a local bottom at $100,300 on June 6, the world’s leading cryptocurrency is regaining upward momentum and approaching a significant resistance zone — its all-time high.
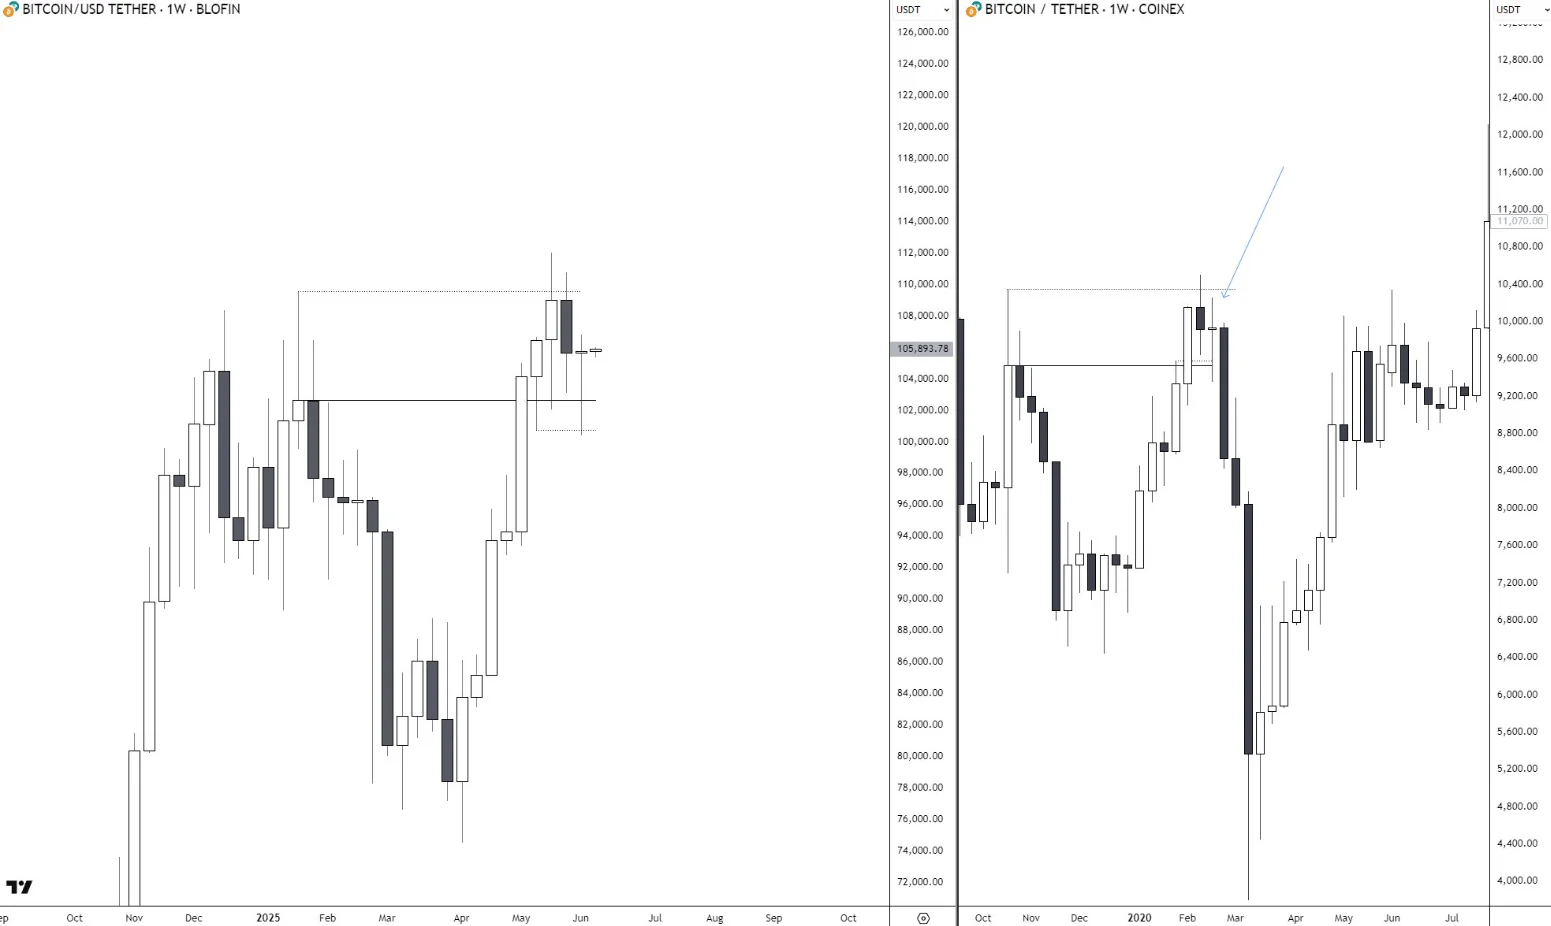
On the weekly chart, a Doji candle has appeared — characterized by a small body and long wicks — reflecting the intense tug-of-war between buyers and sellers. The emergence of this Doji after three weeks of price consolidation suggests that selling pressure may be weakening, potentially paving the way for a new bullish move.
However, crypto analyst Jackis urged caution. He stated:
“This weekly Doji for #Bitcoin, coming after a rejection at last week’s high, isn’t necessarily meaningful. We saw a similar pattern before the COVID crash — although the context now is different. What we really need is a clear breakout in price to confirm the start of a new uptrend.”

Adding to the bullish scenario, trader Krillin highlighted a notable fractal pattern between Bitcoin’s current price action and the phase right after the approval of spot Bitcoin ETFs in January 2024. In this pattern, a so-called “divine candle” typically signals a strong upward move. According to historical data, similar fractals on higher timeframes have been around 70–80% accurate in predicting major trend reversals.
Earlier this year, Bitcoin also posted a strong breakout following a prolonged accumulation phase. With the current price hovering around $106,000 (as of June 9), a similar acceleration could push Bitcoin into the $110,000–$120,000 range in the near future.
Market sentiment is also leaning in favor of long-term holders. According to researcher Axel Adler Jr., the average spot trading volume on centralized exchanges (CEXs) has dropped to its lowest level since October 2020 — just $965.6 million, based on data from CryptoQuant. Meanwhile, derivatives markets remain active, suggesting a return of the “HODL” mindset — holding rather than selling — reminiscent of the accumulation phase before Bitcoin’s late 2020 bull run.
Supporting this view, on-chain analyst Boris pointed out a clear behavioral divergence between short-term and long-term investors.
Over the past 30 days, short-term holders (STH) sold approximately 592,000 BTC as the price neared $110,000 — indicating profit-taking or a lack of confidence in further gains. In contrast, long-term holders (LTH), those who have held BTC for more than 155 days, have accumulated up to 605,000 BTC since the all-time high — reinforcing faith in a renewed bullish cycle.


