Last night, Bitcoin unexpectedly tumbled to $105,000, triggering a wave of sell-offs that dragged the entire cryptocurrency market into the red. The sharp decline was mainly attributed to profit-taking by investors after several consecutive weeks of strong Bitcoin growth.
However, a key technical indicator is now showing the first signs of a potential recovery, suggesting that an upward trend may soon return.
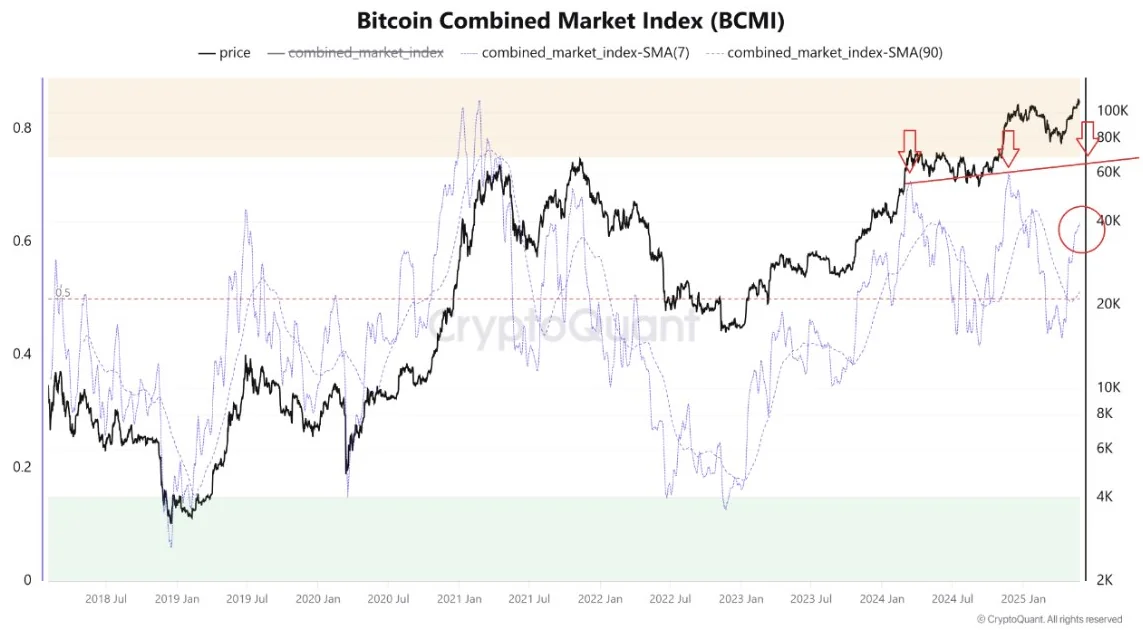
Amid the market correction, the Bitcoin Combined Market Index (BCMI) — a composite measure of investor sentiment and behavior — revealed a notable shift. Specifically, the 7-day moving average of the BCMI rose to 0.6, which many traders interpret as an early bullish signal. Meanwhile, the 90-day average remained stable at 0.45, indicating that the market hasn’t yet entered a state of excessive euphoria.

The BCMI incorporates various metrics such as the Fear & Greed Index, Net Unrealized Profit/Loss (NUPL), Market Value to Realized Value (MVRV), and Spent Output Profit Ratio (SOPR). When the index drops below 0.15, it signals extreme fear — often seen as a buying opportunity. Conversely, a reading above 0.75 suggests overexcitement and may serve as a warning of an imminent correction.
The current phase — where profit-taking activity is slowing and recovery signals begin to emerge — often precedes accumulation periods. During these phases, long-term investors tend to increase their Bitcoin holdings. The shift in the BCMI reflects underlying market strength, even as overall sentiment remains cautious.
Historically, such signs have at times marked the beginning of a new bullish cycle. While Bitcoin’s long-term trend is currently neither dominated by fear nor greed, sustained short-term recovery could indicate growing confidence in a future rally.
Price Movements and Technical Indicators

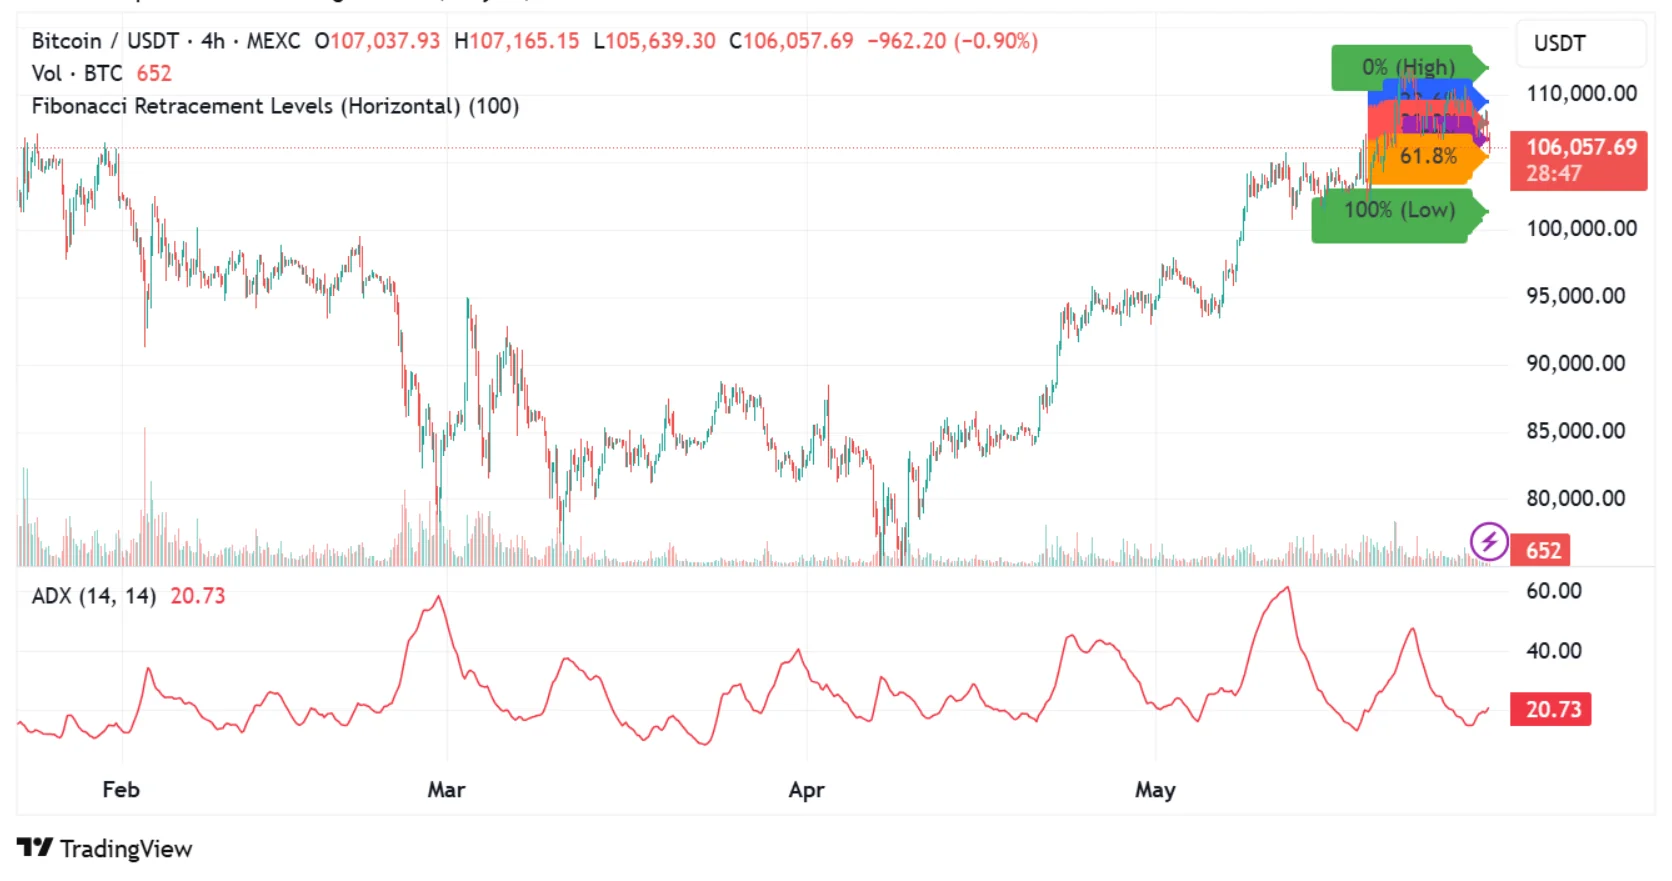
On the 4-hour chart, Fibonacci retracement levels were used to identify potential support and resistance zones. Key price levels to watch include $110,000, $100,000, $95,000, and $80,000 — areas where Bitcoin may face selling pressure or short-term stability.
The Average Directional Index (ADX) currently stands at 20.73, indicating some directional momentum in the market, though not strong enough to confirm a clear trend. Meanwhile, the Relative Strength Index (RSI) is at 35.75 — near the oversold zone — suggesting that selling pressure may be nearing exhaustion after the recent correction.
Notably, earlier today, renowned American financier Anthony Scaramucci predicted that excessive U.S. government spending could be the catalyst that propels Bitcoin to reach $500,000 in the near future.


