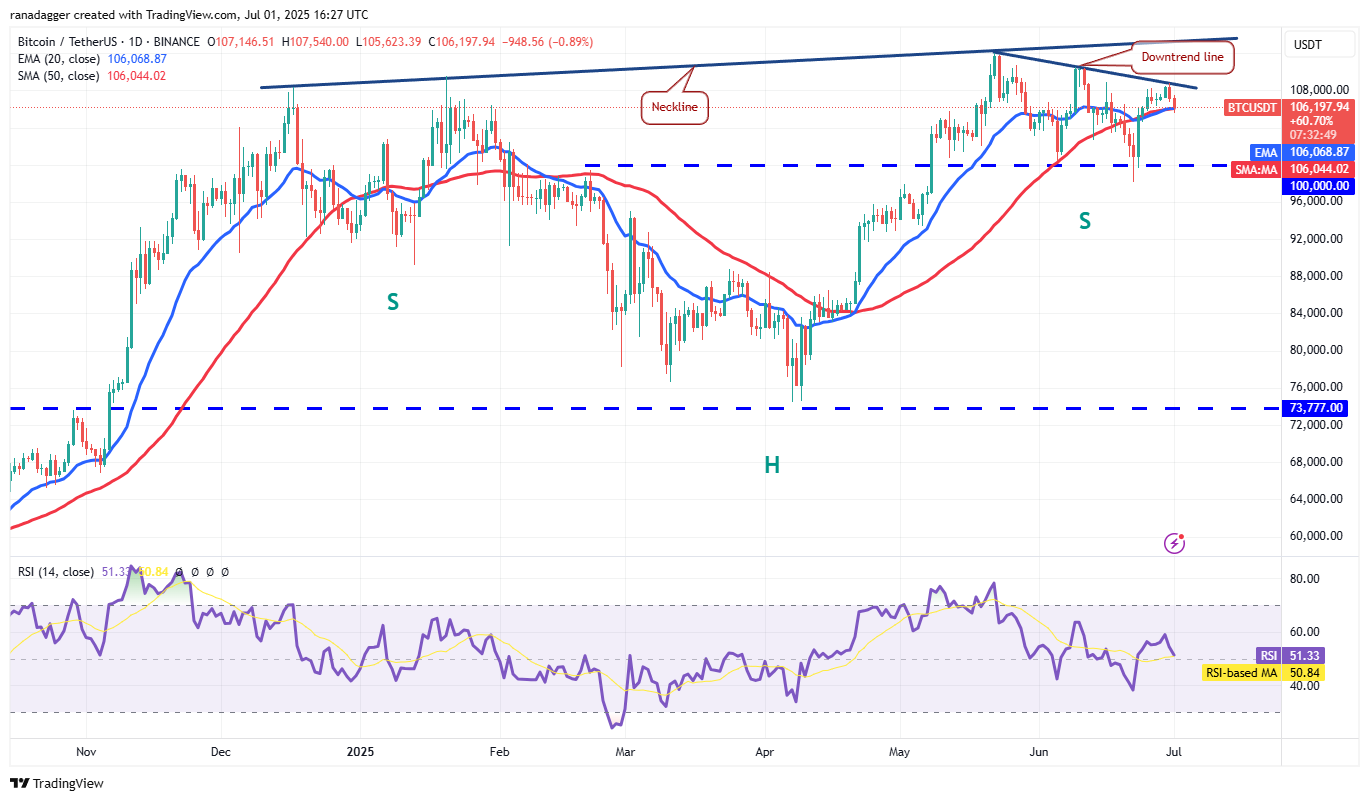
After failing to break above the $109,000 mark earlier this week, Bitcoin pulled back to $105,250 on Tuesday. Analysts at Bitfinex suggested that Bitcoin may have formed a short-term top or is entering a consolidation phase.
The recent price action indicates mounting selling pressure, raising concerns that Bitcoin could revisit the psychologically significant $100,000 level. Let’s analyze the charts to identify the critical support and resistance zones in the short term.
Bitcoin Price Forecast: Rebound or Further Decline?

Currently, Bitcoin is caught between a downtrend line and the moving averages (MAs), suggesting that heightened volatility could occur in the coming days. The upsloping MAs show that bulls still hold a slight advantage, but the Relative Strength Index (RSI) hovering near the midpoint reflects indecision and a lack of strong bullish momentum.
If the price continues to slide and remains below the MAs, the BTC/USDT pair could fall to $104,500, and potentially drop further to the $100,000 support level. This would keep the pair within a bearish descending triangle pattern.
On the other hand, a rebound from the MAs and a breakout above the downtrend line would signal renewed strength, possibly pushing the price up to the neckline of an inverse head-and-shoulders pattern—typically a bullish reversal indicator.
At the moment, Bitcoin has broken below the MAs, pointing to profit-taking by short-term traders. Buyers are expected to strongly defend the $104,500 support. If this level fails to hold, the next stop could be the key psychological support at $100,000.
The first sign of strength will be a breakout above the 20-day Exponential Moving Average (EMA). This could pave the way for a rally toward the downtrend line, where bears will likely reassert pressure. If bulls manage to break through this resistance, Bitcoin could make another run at its all-time high of $111,980.


