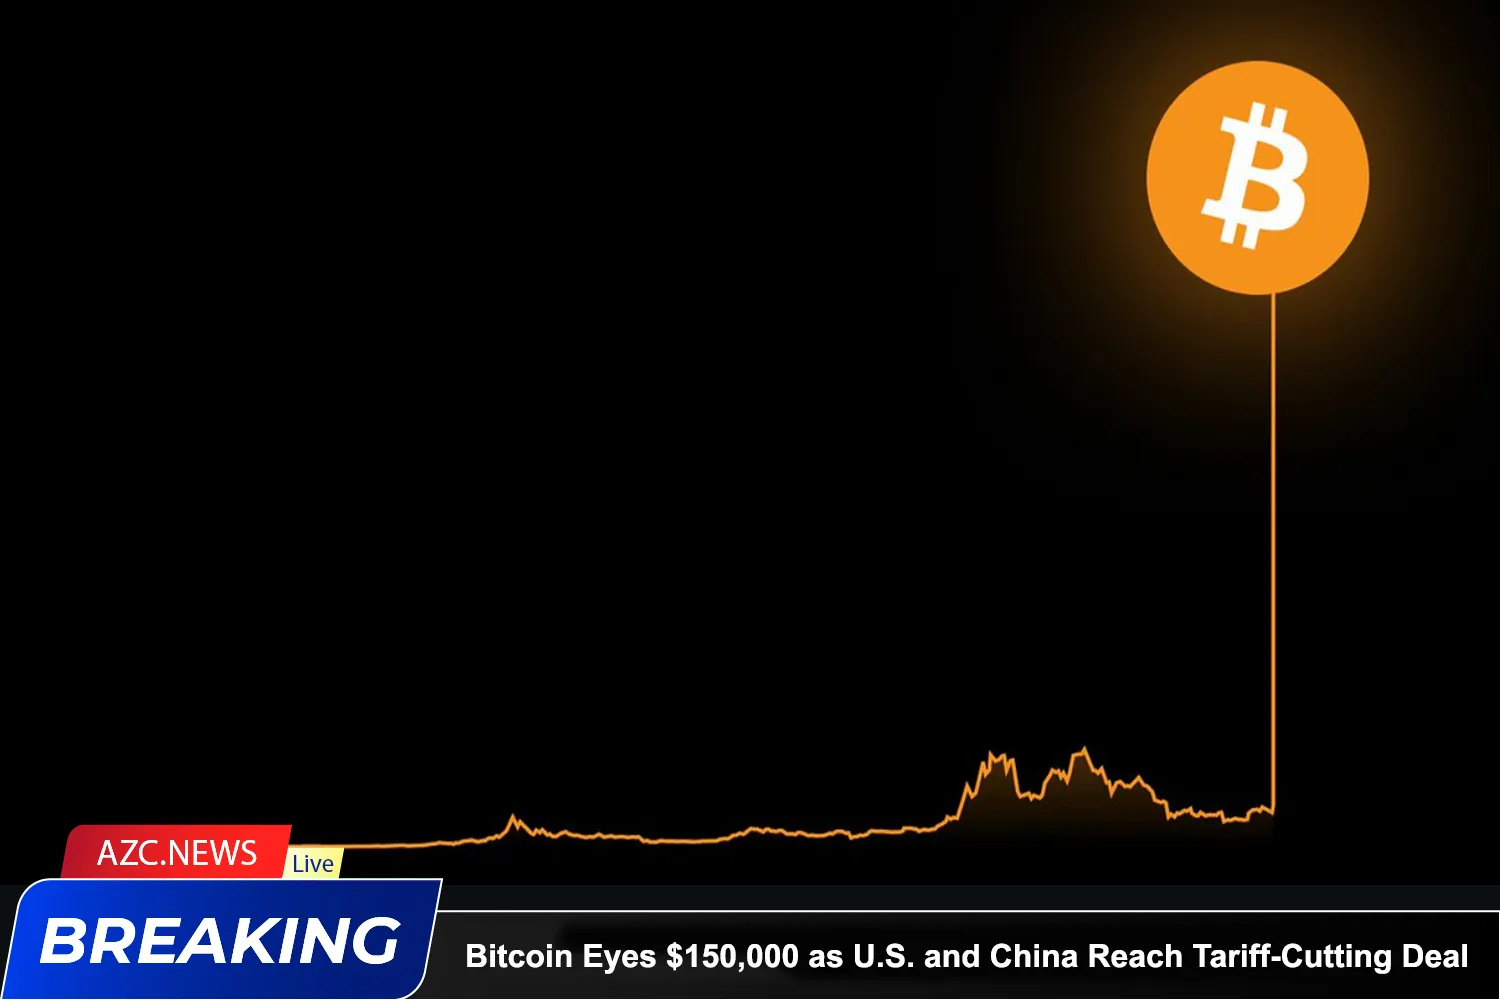
Bitcoin is on a strong upward trajectory following a major breakthrough in U.S.-China trade talks, where both countries agreed to significantly reduce import tariffs. Under the new deal, the U.S. will cut tariffs on Chinese goods from 145% to 30%, while China will slash duties on American imports from 125% to just 10%.
U.S.-China Trade Agreement Fuels Bitcoin Rally
The easing of trade tensions between the world’s two largest economies is seen as a key catalyst behind Bitcoin’s latest surge. Over the weekend, U.S. Treasury Secretary Scott Bessent and Chinese Vice Premier He Lifeng reached an agreement in Geneva to ease long-standing tariff barriers that had severely strained bilateral trade for months.
This development sparked a wave of optimism across global markets. S&P 500 futures rose 2.8%, and the U.S. dollar gained 0.7%. In contrast, gold dropped by 2.3%, signaling a shift away from traditional safe-haven assets toward higher-risk investments.
Bitcoin — often viewed as a high-beta risk asset — had previously suffered from investor caution triggered by the trade war, which dampened capital inflows into the crypto space. The new trade truce signals improved liquidity and greater risk appetite, both of which have historically fueled Bitcoin rallies.
Bull Flag Pattern Points to $150K Target

The current Bitcoin rally is backed by a classic technical indicator: the “bull flag” pattern on the weekly chart — a continuation formation that occurs when prices consolidate in a downward-sloping channel following a strong upward move.
In Bitcoin’s case, the pattern began forming after the cryptocurrency peaked near $110,000 in January. The consolidation phase lasted for several months until early May, when the price broke above the flag’s upper trendline, accompanied by a modest uptick in trading volume — a key confirmation signal.
Based on the height of the initial flagpole, the breakout now projects a potential upside target near $150,000. Supporting this bullish scenario are momentum indicators like the Relative Strength Index (RSI), which recently climbed above 65 on the weekly chart — showing renewed buying pressure without entering overbought territory (above 70).


