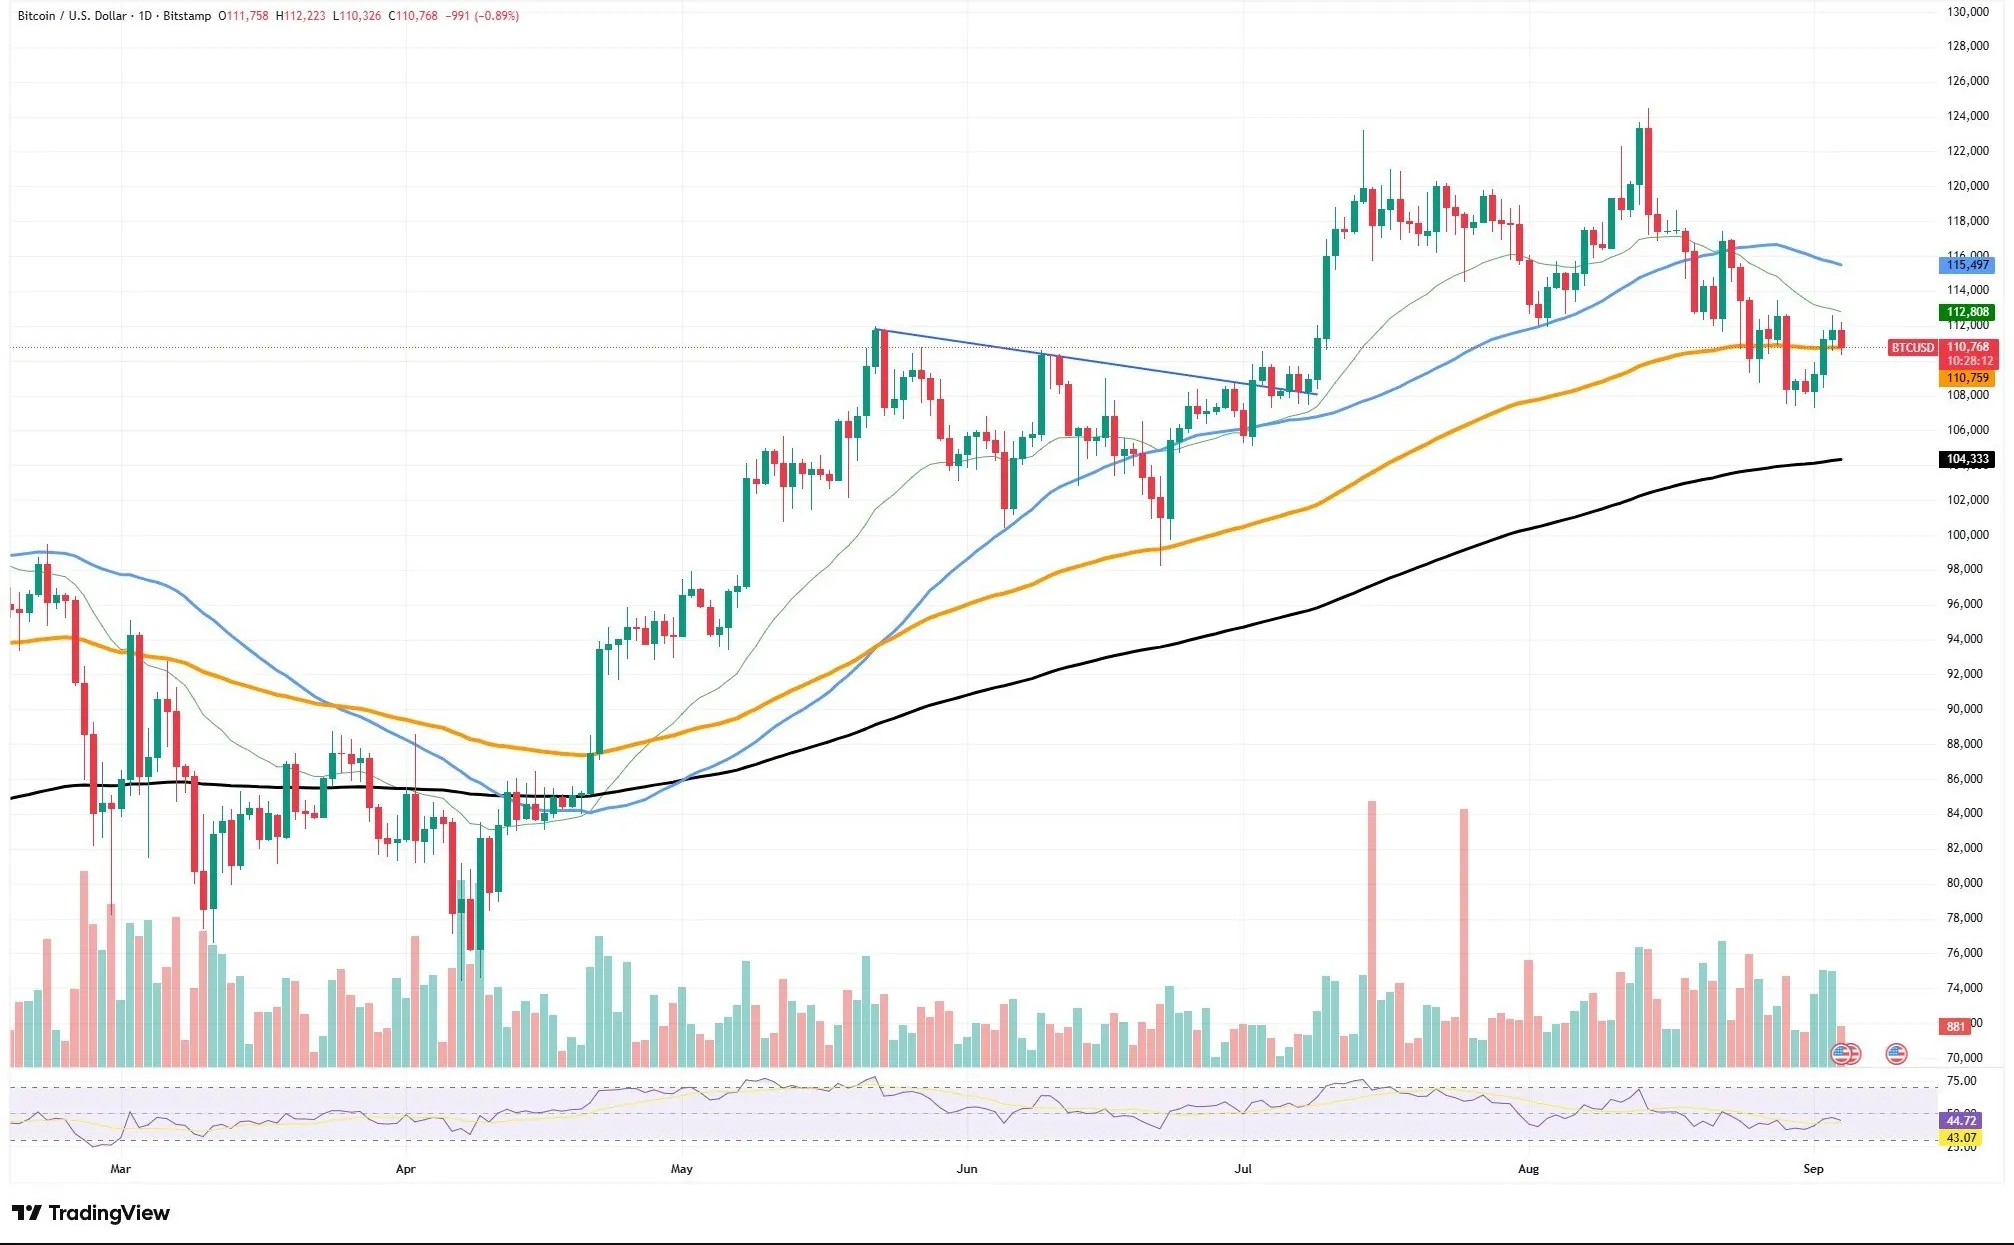
According to recent market analysis, altcoins continue to struggle in weak price zones. The market is approaching a decisive turning point, where the next move could have far-reaching implications for multiple assets. Solana is showing signs of exhaustion after its strong rally, Ethereum is caught in a stalemate, while Bitcoin is hinting at a promising bullish setup.

On the daily chart, Bitcoin appears to be forming the well-known “cup and handle” pattern, one of the most recognized bullish structures in technical analysis. If confirmed, this setup may signal a short-term reversal after weeks of volatile price swings.
From mid-August to early September, BTC declined, consolidated, and steadily recovered to retest resistance around $114,000—shaping the “cup” of the pattern. The subsequent pullback may represent the early phase of the “handle,” a consolidation stage that often precedes a breakout.
Possible Scenarios Ahead
-
Technically, if the handle completes and buyers step in with conviction, Bitcoin could break above the $114,000 resistance and target the $118,000–$120,000 range. This zone also aligns with the 50-day EMA, which has capped recent rallies.
-
A successful breakout would not only validate the cup-and-handle formation but also restore bullish momentum after BTC corrected from highs above $124,000.
-
Conversely, failure to hold the $110,000–$108,000 support zone could expose Bitcoin to a deeper drop toward $104,000, where the 200-day EMA and a key structural level for long-term investors lie.
In the short term, the $114,000 neckline is the level to watch. A decisive breakout above it could launch Bitcoin’s next upward leg, supported by a mini cup-and-handle formation.


